
August 29, 2026 a 09:31 am


Industrial Stocks - Performance Analysis 📊
The industrial sector has shown diverse performance metrics over recent periods, reflecting market volatility and sector-specific dynamics. This report delves into the weekly, monthly, and quarterly performance of prominent industrial stocks, highlighting both growth trends and areas of concern. We aim to identify top performers as well as stocks that have underperformed, offering valuable insights for investors in this evolving market landscape.
Industrial Stocks Performance One Week 📈
| Stock | Performance (%) | Performance |
|---|---|---|
| UPS | 3.25 | |
| ADP | 2.36 | |
| RTX | 0.86 | |
| HON | 0.74 | |
| UNP | -0.20 | |
| GE | -1.56 | |
| BA | -2.05 | |
| DE | -2.61 | |
| CAT | -3.35 | |
| ETN | -3.88 |
Industrial Stocks Performance One Month 🗓️
| Stock | Performance (%) | Performance |
|---|---|---|
| ADP | 8.74 | |
| UNP | 6.11 | |
| DE | 5.52 | |
| ETN | 4.81 | |
| UPS | 0.31 | |
| CAT | -0.64 | |
| RTX | -1.10 | |
| GE | -3.11 | |
| BA | -4.63 | |
| HON | -10.29 |
Industrial Stocks Performance Three Months 📉
| Stock | Performance (%) | Performance |
|---|---|---|
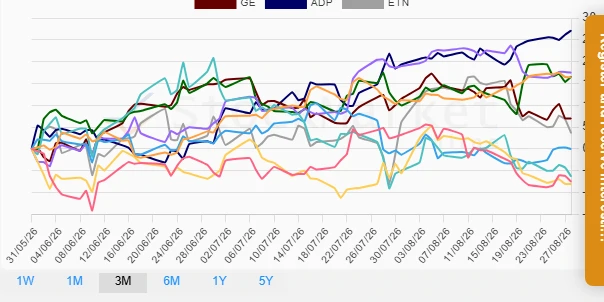
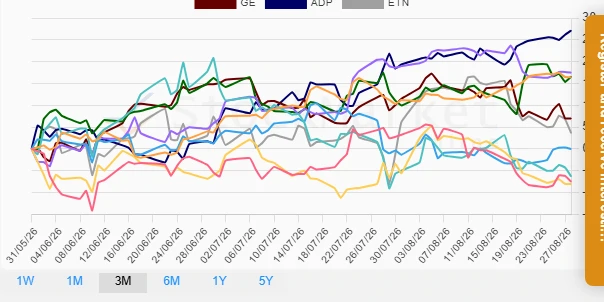
| ADP | 27.13 | |
| RTX | 17.48 | |
| DE | 16.59 | |
| UNP | 16.41 | |
| GE | 6.97 | |
| ETN | 3.62 | |
| CAT | -6.31 | |
| HON | -7.52 | |
| BA | -8.04 | |
| UPS | -0.02 |
Summary ✅
The industrial sector's performance over the three observed periods highlights the sector's resilience amidst market fluctuations. Significant performers like ADP, RTX, and DE illustrate potential growth opportunities, especially noted in their three-month returns. Conversely, HON and BA have consistently underperformed, presenting potential risks that require cautious examination. This analysis urges a balanced approach, considering both growth outliers and underperformers, while remaining vigilant towards broader economic indicators impacting the industrial sector.
Smart Data Insight
Master the Perfect Entry & Exit for this Stock
Don't leave your profits to chance. Historically, this stock follows specific seasonal patterns that institutional traders use to maximize returns.
- ✅ Identify the "Golden Buying Window"
- ✅ Avoid high-risk correction cycles
- ✅ Backtested data from the last 20+ years