September 27, 2025 a 09:31 am


Industrial Stocks - Performance Analysis
The industrial sector has shown varied performance across different timeframes, reflecting both macroeconomic influences and individual stock dynamics. This analysis delves into the performance of leading industrial stocks, identifying top performers and underperformers over one week, one month, and three months. Observing these trends can guide investment strategies and risk assessment in this ever-fluctuating sector.
Industrial Stocks Performance One Week 📊
During this one-week period, Union Pacific (UNP) was the standout performer with a significant rise of 6.45%, showcasing strong investor confidence and potential positive market catalysts. Conversely, Eaton Corp (ETN) struggled, marking the largest decline at -2.35%. This period highlights both the volatility within the sector and the disparate performance among companies.
| Stock | Performance (%) | Performance |
|---|---|---|
| UNP | 6.45% | |
| RTX | 3.20% | |
| BA | 2.67% | |
| CAT | -0.15% | |
| ADP | -0.14% | |
| UPS | -0.38% | |
| HON | -0.56% | |
| DE | -1.21% | |
| GE | -2.03% | |
| ETN | -2.35% |
Industrial Stocks Performance One Month 📊
Throughout the one-month period, Caterpillar (CAT) and General Electric (GE) showed impressive gains of 7.09% and 6.87% respectively, indicating a robust response to current market conditions. On the other hand, Boeing (BA) experienced a notable downturn at -6.30%, suggesting sector-specific challenges or company-centric issues.
| Stock | Performance (%) | Performance |
|---|---|---|
| CAT | 7.09% | |
| GE | 6.87% | |
| UNP | 5.70% | |
| ETN | 3.13% | |
| RTX | 1.79% | |
| UPS | -4.07% | |
| ADP | -4.12% | |
| DE | -5.64% | |
| HON | -6.06% | |
| BA | -6.30% |
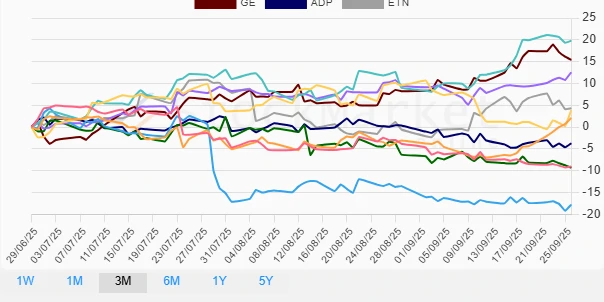
Industrial Stocks Performance Three Months 📊
In the three-month review, Caterpillar (CAT) led the field with an impressive 19.77% gain, followed by General Electric (GE) which saw an increase of 15.40%. On the downside, UPS recorded a significant decline of -17.78%, more than likely due to competitive pressures or operational challenges.
| Stock | Performance (%) | Performance |
|---|---|---|
| CAT | 19.77% | |
| GE | 15.40% | |
| RTX | 12.56% | |
| ETN | 4.32% | |
| BA | 3.84% | |
| UNP | 2.08% | |
| ADP | -3.71% | |
| HON | -9.01% | |
| DE | -9.33% | |
| UPS | -17.78% |
Summary 📈
The industrial sector's performance is a testament to its inherent volatility and diverse nature. Over these periods, stocks like Caterpillar and General Electric have shown resilience and growth potential, whereas UPS and Boeing faced challenges. For investors, a balanced approach that hedges against sector-specific risks while capitalizing on periods of growth is advised. Continuous market monitoring and strategic positioning can enhance returns while mitigating potential downsides.
Smart Data Insight
Master the Perfect Entry & Exit for this Stock
Don't leave your profits to chance. Historically, this stock follows specific seasonal patterns that institutional traders use to maximize returns.
- ✅ Identify the "Golden Buying Window"
- ✅ Avoid high-risk correction cycles
- ✅ Backtested data from the last 20+ years