
September 26, 2026 a 09:31 am


Industrial Stocks - Performance Analysis
The industrial sector's recent performance showcases a diverse array of results across varying time spans, reflecting broader economic conditions influencing these assets. Investors will find pivotal insights in the analysis of weekly, monthly, and quarterly movements. Understanding these trends is crucial for making well-informed strategic decisions, potentially impacting portfolio allocations.
📊 Industrial Stocks Performance One Week
| Stock | Performance (%) | Performance |
|---|---|---|
| GE | 4.04 | |
| ETN | 3.57 | |
| HON | 2.94 | |
| CAT | 1.59 | |
| DE | 1.01 | |
| BA | -0.02 | |
| RTX | -2.35 | |
| UNP | -1.94 | |
| ADP | -2.80 | |
| UPS | -5.08 |
📊 Industrial Stocks Performance One Month
| Stock | Performance (%) | Performance |
|---|---|---|
| DE | 10.66 | |
| ETN | 6.38 | |
| CAT | 0.83 | |
| GE | -4.44 | |
| BA | -5.56 | |
| ADP | -7.47 | |
| RTX | -11.16 | |
| UPS | -11.39 | |
| HON | -3.45 | |
| UNP | -11.46 |
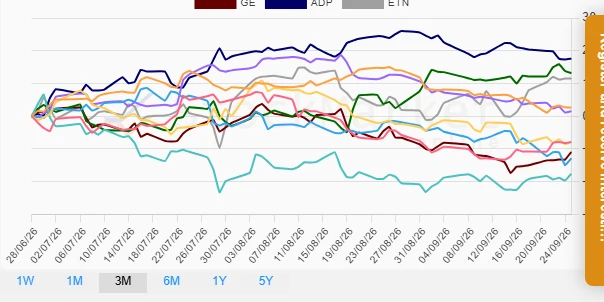
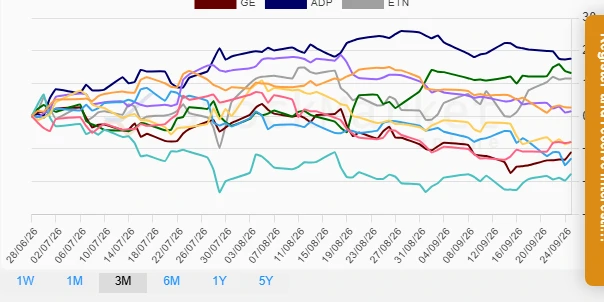
📊 Industrial Stocks Performance Three Months
| Stock | Performance (%) | Performance |
|---|---|---|
| ADP | 17.57 | |
| DE | 13.16 | |
| ETN | 11.49 | |
| UNP | 2.62 | |
| RTX | 1.52 | |
| HON | -7.86 | |
| BA | -7.93 | |
| GE | -10.96 | |
| UPS | -12.92 | |
| CAT | -17.62 |
🔍 Summary
The industrial sector's performance indicates divergent trajectories influenced by varying market conditions over different time frames. Short-term assessments reveal prominent gains in select stocks, such as GE and ETN, while offering a cautionary note on consistently negative performers like UPS. The monthly analysis emphasizes DE's significant rise amid a challenging environment, showcasing resilience. Moreover, the quarterly outlook presents ADP as a stellar performer, suggesting bullish momentum. Investors should consider these insights for strategic realignment, leveraging top performers while mitigating risks related to underperforming assets.
Smart Data Insight
Master the Perfect Entry & Exit for this Stock
Don't leave your profits to chance. Historically, this stock follows specific seasonal patterns that institutional traders use to maximize returns.
- ✅ Identify the "Golden Buying Window"
- ✅ Avoid high-risk correction cycles
- ✅ Backtested data from the last 20+ years