
April 25, 2026 a 09:31 am


Industrial Stocks - Performance Analysis
📊 The industrial sector's performance over various timeframes highlights the volatility and diverse trends affecting this cornerstone of the global economy. This analysis scrutinizes the short, medium, and long-term movement of key players, providing valuable insights for investors seeking to navigate the complex landscape of industrial stocks. We observe significant variances in performances, indicating a dynamic market environment driven by both macroeconomic factors and company-specific developments. Let's delve into the specifics of each period to better understand the undercurrents influencing these industrial giants.
Industrial Stocks Performance One Week
💡 Over the past week, industrial stocks have exhibited varied performance patterns. RTX faced the largest decline, potentially due to recent sector-specific challenges. Conversely, UNP showed robust growth, marking a significant deviation from its peers. Such disparities indicate differing impacts of current economic conditions across the industrial landscape.
| Stock | Performance (%) | Performance |
|---|---|---|
| RTX | -11.76 | |
| HON | -9.02 | |
| GE | -6.38 | |
| DE | -4.65 | |
| ADP | -1.96 | |
| UPS | 0.58 | |
| BA | 4.17 | |
| CAT | 4.51 | |
| ETN | 4.30 | |
| UNP | 7.13 |
Industrial Stocks Performance One Month
🔍 A one-month evaluation reveals Boeing (BA) as a significant beneficiary with an impressive 18.49% growth, likely propelled by positive market sentiments or operational efficiencies. In stark contrast, RTX continues to battle downward pressures, registering at -9.76%. The month observed strong recoveries and setbacks, narrating a tale of varied resilience and strategic responses within the industrial sector.
| Stock | Performance (%) | Performance |
|---|---|---|
| RTX | -9.76 | |
| HON | -5.21 | |
| ADP | -3.71 | |
| DE | -2.73 | |
| GE | 0.76 | |
| UPS | 9.53 | |
| CAT | 17.41 | |
| ETN | 17.64 | |
| BA | 18.49 | |
| UNP | 12.06 |
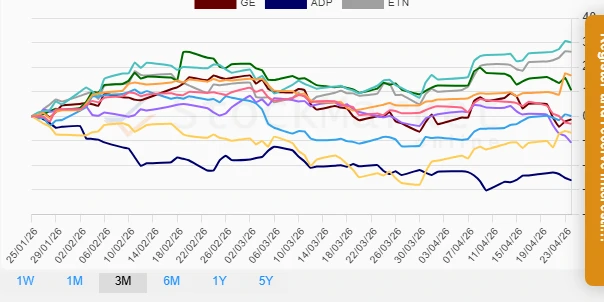
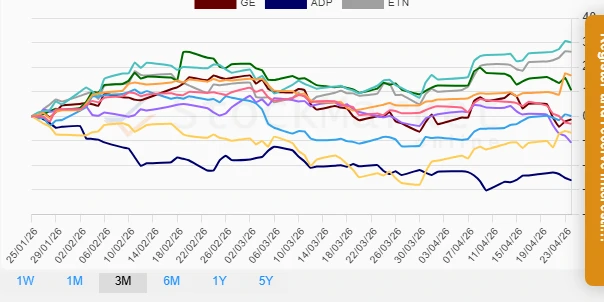
Industrial Stocks Performance Three Months
📈 In the three-month view, CAT and ETN emerge as leaders, with substantial increases, reflecting potential operational efficiencies or favorable market conditions. Meanwhile, ADP experienced significant downward pressure, standing out uniquely in its decline. The pronounced performance differences provide essential insights for recalibrating investment portfolios towards more resilient entities.
| Stock | Performance (%) | Performance |
|---|---|---|
| ADP | -26.11 | |
| RTX | -10.76 | |
| BA | -6.71 | |
| HON | -3.10 | |
| GE | -1.31 | |
| UPS | 0.09 | |
| DE | 10.64 | |
| UNP | 16.54 | |
| ETN | 26.27 | |
| CAT | 30.08 |
Summary
🗣️ The analysis of industrial stocks over different time horizons unveils pivotal insights. While some stocks like CAT and ETN thrived, illustrating resilience and potential alignment with positive market influences, others like RTX and ADP faced substantial challenges. An investor's strategy should consider the nuanced performance trends and potential external economic variables at play. A focus on key growth areas within the sector and a critical view on underperformers can guide strategic investment decisions, balancing risk and opportunity within this vital economic segment.
Smart Data Insight
Master the Perfect Entry & Exit for this Stock
Don't leave your profits to chance. Historically, this stock follows specific seasonal patterns that institutional traders use to maximize returns.
- ✅ Identify the "Golden Buying Window"
- ✅ Avoid high-risk correction cycles
- ✅ Backtested data from the last 20+ years