January 24, 2026 a 09:31 am


Industrial Stocks - Performance Analysis
The industrial sector's stock performance over various time horizons reveals both strengths and challenges. Short-term fluctuations are evident, as are longer-term trends that may indicate strategic opportunities. Through this analysis, we aim to highlight key performers and underperformers, shedding light on potential investment adjustments.
Industrial Stocks Performance One Week 📊
| Stock | Performance (%) | Performance |
|---|---|---|
| BA | 1.79% | |
| UPS | 1.02% | |
| HON | 0.99% | |
| UNP | 0.19% | |
| DE | 0.11% | |
| ADP | -0.96% | |
| RTX | -2.97% | |
| CAT | -3.06% | |
| ETN | -3.68% | |
| GE | -9.72% |
Industrial Stocks Performance One Month 📈
| Stock | Performance (%) | Performance |
|---|---|---|
| BA | 14.73% | |
| HON | 11.95% | |
| DE | 10.03% | |
| CAT | 7.53% | |
| UPS | 7.17% | |
| RTX | 5.20% | |
| ETN | 2.59% | |
| ADP | 0.05% | |
| UNP | -2.06% | |
| GE | -6.89% |
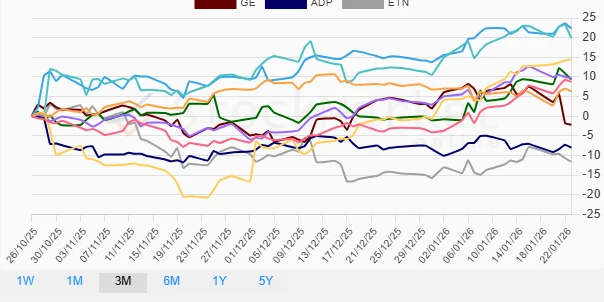
Industrial Stocks Performance Three Months 📉
| Stock | Performance (%) | Performance |
|---|---|---|
| UPS | 22.37% | |
| CAT | 19.91% | |
| BA | 14.49% | |
| RTX | 9.75% | |
| DE | 9.37% | |
| HON | 8.78% | |
| UNP | 6.31% | |
| GE | -2.17% | |
| ADP | -8.01% | |
| ETN | -11.55% |
Summary 💡
The analysis reveals substantial divergence across different time periods, depicting both volatility and potential resilience in industrial stocks. Over the short term, GE's significant decline stands out, juxtaposed with BA's robust performance. Over one month, BA additionally shows substantial gains, pointing towards promising momentum. The three-month horizon highlights UPS and CAT as leading performers, while ETN weakens significantly. These findings underline the necessity for strategic allocation decisions considering both cyclical movements and sustained long-term trends.
Smart Data Insight
Master the Perfect Entry & Exit for this Stock
Don't leave your profits to chance. Historically, this stock follows specific seasonal patterns that institutional traders use to maximize returns.
- ✅ Identify the "Golden Buying Window"
- ✅ Avoid high-risk correction cycles
- ✅ Backtested data from the last 20+ years