August 23, 2025 a 09:31 am


Industrial Stocks - Performance Analysis
The industrial sector has shown mixed performance in recent timeframes, with some stocks standing out as top performers while others have struggled. This analysis delves into the short-term and mid-term performances of leading industrial stocks, revealing key trends and insights to guide investment strategies. From short-term fluctuations to more stable long-term trends, we've examined the factors driving stock movements and identified potential opportunities and risks.
Industrial Stocks Performance One Week 📊
| Stock | Performance (%) | Performance |
|---|---|---|
| CAT | 6.72% | |
| UNP | 3.17% | |
| HON | 2.79% | |
| ADP | 2.04% | |
| DE | 1.50% | |
| RTX | 1.43% | |
| UPS | 0.47% | |
| GE | -0.49% | |
| ETN | -0.96% | |
| BA | -2.11% |
Industrial Stocks Performance One Month 📈
| Stock | Performance (%) | Performance |
|---|---|---|
| UNP | 3.41% | |
| CAT | 1.66% | |
| RTX | 0.72% | |
| ADP | 0.69% | |
| BA | -0.20% | |
| GE | -0.39% | |
| HON | -0.65% | |
| DE | -3.18% | |
| ETN | -9.82% | |
| UPS | -13.49% |
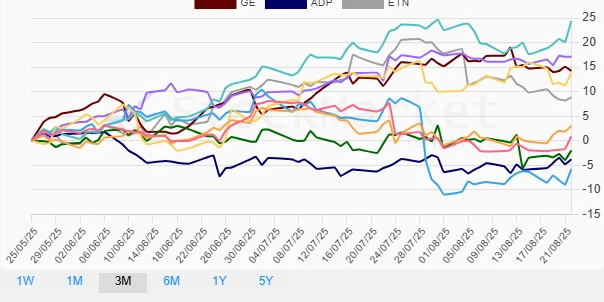
Industrial Stocks Performance Three Months 📉
| Stock | Performance (%) | Performance |
|---|---|---|
| CAT | 24.36% | |
| RTX | 17.08% | |
| GE | 14.24% | |
| BA | 13.82% | |
| ETN | 8.85% | |
| UNP | 3.00% | |
| HON | 0.84% | |
| DE | -2.01% | |
| UPS | -5.84% | |
| ADP | -3.80% |
Summary ⚠️
The industrial sector shows a dynamic range of performances across various timeframes. Short-term gains were most pronounced in stocks like Caterpillar and Union Pacific, but sectors such as DE and UPS have faced challenges. Over a three-month period, Caterpillar's impressive growth is notable, mirroring a strong recovery phase or a strategic market move. Conversely, prolonged underperformance by UPS suggests potential vulnerabilities or strategic inefficiencies. Investors should consider both short-term gains and long-term trends, aligning with their risk appetite and investment strategy. The marked dominance of some stocks may point towards industry leadership, while underperformance flags potential critical areas requiring attention.