March 21, 2026 a 09:31 am


📊 Industrial Stocks - Performance Analysis
Amidst the dynamic landscape of the industrial sector, recent performance metrics showcase a vivid tapestry of gains and setbacks. With volatile market scenarios, strategic insights into temporal stock movements provide invaluable foresight. Analyzing the weekly, monthly, and three-month periods, we glean trends and implications critical for making informed investment decisions.
📈 Industrial Stocks Performance One Week
| Stock | Performance (%) | Performance |
|---|---|---|
| ETN | 0.42% | |
| ADP | 0.09% | |
| UPS | -1.38% | |
| CAT | -1.89% | |
| DE | -3.10% | |
| UNP | -3.10% | |
| RTX | -3.12% | |
| GE | -4.32% | |
| HON | -5.65% | |
| BA | -7.17% |
📈 Industrial Stocks Performance One Month
| Stock | Performance (%) | Performance |
|---|---|---|
| ADP | -3.06% | |
| RTX | -3.25% | |
| ETN | -5.16% | |
| HON | -8.13% | |
| CAT | -10.70% | |
| UNP | -11.10% | |
| GE | -14.96% | |
| DE | -16.54% | |
| BA | -17.51% | |
| UPS | -18.28% |
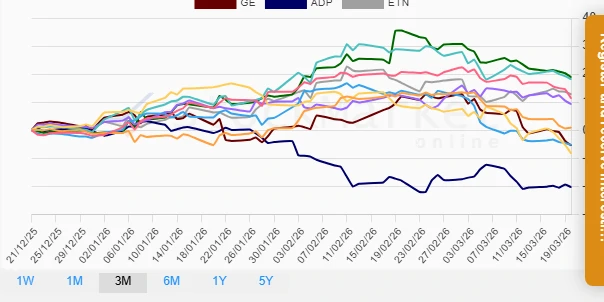
📈 Industrial Stocks Performance Three Months
| Stock | Performance (%) | Performance |
|---|---|---|
| DE | 18.92% | |
| CAT | 18.17% | |
| ETN | 12.78% | |
| HON | 11.32% | |
| RTX | 9.28% | |
| UNP | 0.94% | |
| UPS | -5.24% | |
| GE | -5.44% | |
| BA | -8.26% | |
| ADP | -20.30% |
🔍 Summary
The analysis reveals significant divergences in performance within the industrial sector, with variances driven largely by market shifts and sector-specific challenges. Over one week, Eaton (ETN) and ADP showed resilience, whereas Boeing (BA) faced notable setbacks. The one-month overview was dominated by widespread losses, led by UPS and Boeing. However, the three-month analysis provides a more optimistic view, with Deere (DE) and Caterpillar (CAT) registering impressive gains. Cumulatively, opportunistic investments can be explored in currently undervalued stocks showing long-term recovery potential, bolstered by specific sector trends.
Smart Data Insight
Master the Perfect Entry & Exit for this Stock
Don't leave your profits to chance. Historically, this stock follows specific seasonal patterns that institutional traders use to maximize returns.
- ✅ Identify the "Golden Buying Window"
- ✅ Avoid high-risk correction cycles
- ✅ Backtested data from the last 20+ years