February 21, 2026 a 09:31 am


Industrial Stocks - Performance Analysis
📊 The industrial sector has shown a mixed performance over recent periods, with both impressive gains and significant drops. This analysis aims to systematically evaluate these variations over one week, one month, and three months, providing insights into the trends and potential implications for investors.
Industrial Stocks Performance One Week
| Stock | Performance (%) | Performance |
|---|---|---|
| DE | 10.05 | |
| GE | 8.56 | |
| RTX | 2.41 | |
| UNP | 2.07 | |
| ADP | 1.14 | |
| HON | 1.09 | |
| CAT | -1.85 | |
| UPS | -2.07 | |
| ETN | -4.10 | |
| BA | -4.55 |
Industrial Stocks Performance One Month
| Stock | Performance (%) | Performance |
|---|---|---|
| DE | 24.65 | |
| CAT | 16.58 | |
| GE | 15.47 | |
| UNP | 14.21 | |
| ETN | 11.63 | |
| HON | 9.42 | |
| UPS | 6.93 | |
| RTX | 4.49 | |
| BA | -7.80 | |
| ADP | -18.82 |
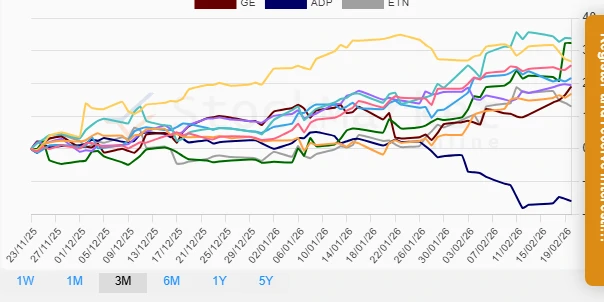
Industrial Stocks Performance Three Months
| Stock | Performance (%) | Performance |
|---|---|---|
| CAT | 33.77 | |
| DE | 32.38 | |
| BA | 26.75 | |
| HON | 25.51 | |
| UPS | 21.67 | |
| RTX | 19.52 | |
| GE | 19.03 | |
| UNP | 16.83 | |
| ETN | 13.03 | |
| ADP | -15.94 |
Summary
✅ The performance of industrial stocks over the analyzed periods reflects robust growth in stocks like Deere (DE) and Caterpillar (CAT) over the three-month period, with Deere showing consistent strength throughout all intervals. Conversely, stocks such as Boeing (BA) and Automatic Data Processing (ADP) have experienced notable volatilities, with ADP underperforming in the broader spectrum. This trend indicates potential strategic focal points for investors considering the industrial sector, with an emphasis on assessing the recovery or sustained performance capabilities of key players. 🗣️ Investors should remain vigilant of macroeconomic influences and sector-specific trends in assessing future performance potential.
Smart Data Insight
Master the Perfect Entry & Exit for this Stock
Don't leave your profits to chance. Historically, this stock follows specific seasonal patterns that institutional traders use to maximize returns.
- ✅ Identify the "Golden Buying Window"
- ✅ Avoid high-risk correction cycles
- ✅ Backtested data from the last 20+ years