
June 20, 2026 a 09:31 am


Industrial Stocks - Performance Analysis
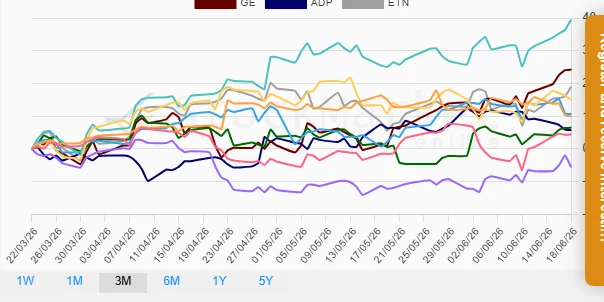
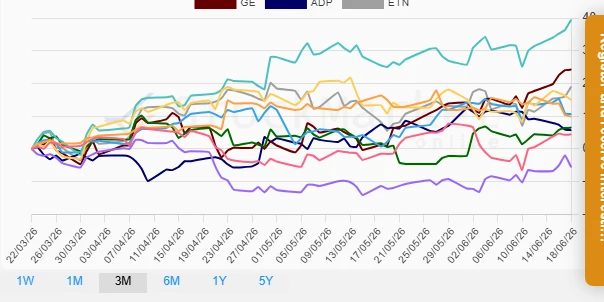
In a dynamic market environment, assessing the performance of industrial stocks provides key insights into sector health and investor sentiment. Recent data spanning one week, one month, and three months suggest diverse trajectories amongst leading corporations such as Caterpillar, General Electric, and Boeing. This analysis explores short and long-term movements, highlighting top gainers and underperformers within the industrial sector.
Industrial Stocks Performance One Week
📊 Analyzing the one-week performance, Caterpillar (CAT) emerged as the top performer with a significant rise of 8.04%, followed closely by Eaton (ETN) with 7.59%. Contrarily, Union Pacific (UNP) underwhelmed with a -5.88% drop. This trend suggests a rotation into select industrials, possibly driven by strategic developments and broader economic indicators.
| Stock | Performance (%) | Performance |
|---|---|---|
| CAT | 8.04 | |
| ETN | 7.59 | |
| GE | 6.53 | |
| HON | 3.92 | |
| DE | 2.03 | |
| BA | 1.77 | |
| RTX | 1.25 | |
| UPS | -2.93 | |
| ADP | -3.49 | |
| UNP | -5.88 |
Industrial Stocks Performance One Month
📈 Over the one-month period, General Electric (GE) led the sector with a remarkable 17.48% increase. Caterpillar (CAT) also advanced significantly by 13.75%. Meanwhile, Union Pacific (UNP) continued its downward trend with a -2.88% decline, indicating persistent challenges.
| Stock | Performance (%) | Performance |
|---|---|---|
| GE | 17.48 | |
| CAT | 13.75 | |
| ETN | 10.83 | |
| DE | 10.71 | |
| UPS | 7.01 | |
| RTX | 5.72 | |
| HON | 2.93 | |
| BA | 2.01 | |
| ADP | -0.46 | |
| UNP | -2.88 |
Industrial Stocks Performance Three Months
🔍 Examining the three-month period, Caterpillar (CAT) saw an impressive growth of 39.47%, a testament to potential operational and strategic successes. Boeing (BA) and GE also posted robust returns at 14.99% and 24.24%, respectively. RTX was the only noticeable laggard at -5.56%, indicating company-specific challenges or sectoral rotation.
| Stock | Performance (%) | Performance |
|---|---|---|
| CAT | 39.47 | |
| GE | 24.24 | |
| ETN | 18.97 | |
| BA | 14.99 | |
| UNP | 9.89 | |
| UPS | 10.61 | |
| ADP | 5.74 | |
| DE | 6.52 | |
| HON | 4.47 | |
| RTX | -5.56 |
Summary
💡 The analysis indicates that while certain industrial stocks have performed robustly, such as Caterpillar, General Electric, and Boeing, others face challenges. Diversification within the sector should consider wider economic drivers and individual company strengths. For future investment decisions, evaluating sectoral trends alongside these individual performances would prove beneficial.
Smart Data Insight
Master the Perfect Entry & Exit for this Stock
Don't leave your profits to chance. Historically, this stock follows specific seasonal patterns that institutional traders use to maximize returns.
- ✅ Identify the "Golden Buying Window"
- ✅ Avoid high-risk correction cycles
- ✅ Backtested data from the last 20+ years