October 18, 2025 a 09:31 am


Industrial Stocks - Performance Analysis
🏭 The industrial sector exhibited a diverse range of performances over the past quarter, with some companies achieving significant gains while others faced declines. This analysis dissects the performance of the top industrial stocks across three timeframes: one week, one month, and three months. Understanding the insights drawn from these performances provides a valuable roadmap for current and future investment strategies.
📊 Industrial Stocks Performance One Week
| Stock | Performance (%) | Performance |
|---|---|---|
| CAT | 7.21 | |
| UPS | 4.21 | |
| GE | 2.95 | |
| DE | 2.73 | |
| ETN | 1.18 | |
| HON | 1.11 | |
| BA | 1.08 | |
| UNP | 0.27 | |
| RTX | 0.17 | |
| ADP | -1.37 |
📈 Industrial Stocks Performance One Month
| Stock | Performance (%) | Performance |
|---|---|---|
| CAT | 12.44 | |
| UNP | 2.67 | |
| UPS | 1.73 | |
| GE | 1.16 | |
| ETN | 0.75 | |
| RTX | 0.03 | |
| BA | -0.95 | |
| ADP | -3.31 | |
| HON | -3.35 | |
| DE | -3.62 |
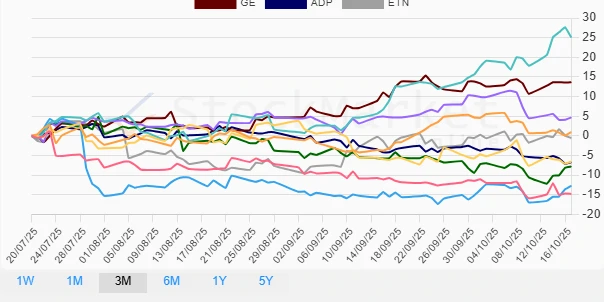
📉 Industrial Stocks Performance Three Months
| Stock | Performance (%) | Performance |
|---|---|---|
| CAT | 25.07 | |
| GE | 13.66 | |
| RTX | 4.68 | |
| UNP | 0.97 | |
| ETN | -0.55 | |
| BA | -6.59 | |
| ADP | -6.74 | |
| DE | -7.82 | |
| UPS | -12.71 | |
| HON | -14.79 |
🔍 Summary
✨ The analysis reveals that Caterpillar (CAT) consistently outperformed its peers across all time periods, highlighting its position as a robust leader in the industrial sector. However, Honeywell (HON) and Deere & Company (DE) showcased notable weaknesses, particularly over a three-month span, reflecting potential areas of concern. Overall, while the industrial sector shows promising opportunities, a cautious approach is advised with consideration towards stocks showing consistent upward trends.
Smart Data Insight
Master the Perfect Entry & Exit for this Stock
Don't leave your profits to chance. Historically, this stock follows specific seasonal patterns that institutional traders use to maximize returns.
- ✅ Identify the "Golden Buying Window"
- ✅ Avoid high-risk correction cycles
- ✅ Backtested data from the last 20+ years