
April 18, 2026 a 09:31 am


📊 Industrial Stocks - Performance Analysis
Industrial sector equities have demonstrated diverse performance patterns over the recent week, month, and quarter. We delve into the data to analyze the top gainers and underperformers among these significant industrial stocks, interpret the underlying trends, and provide insights for potential strategic investment decisions.
🔍 Industrial Stocks Performance One Week
The one-week performance of industrial stocks displays a broad range of outcomes, with ADP leading as the top performer and RTX trailing as the weakest. The overall market mood appears cautiously optimistic, with notable gains in specific equities.
| Stock | Performance (%) | Performance |
|---|---|---|
| ADP | 6.08% | |
| UPS | 4.58% | |
| BA | 2.67% | |
| ETN | 0.87% | |
| CAT | 0.60% | |
| UNP | 0.28% | |
| HON | -0.61% | |
| GE | -1.19% | |
| DE | -2.35% | |
| RTX | -2.54% |
🔍 Industrial Stocks Performance One Month
Over the one-month period, CAT has outperformed with a substantial gain, demonstrating robust investor confidence in its growth outlook. Conversely, ADP witnessed the most notable decline, reflecting sector-specific challenges.
| Stock | Performance (%) | Performance |
|---|---|---|
| CAT | 15.10% | |
| ETN | 12.67% | |
| BA | 10.99% | |
| UPS | 9.96% | |
| UNP | 7.07% | |
| GE | 5.06% | |
| DE | 4.35% | |
| HON | 2.18% | |
| RTX | -1.97% | |
| ADP | -4.67% |
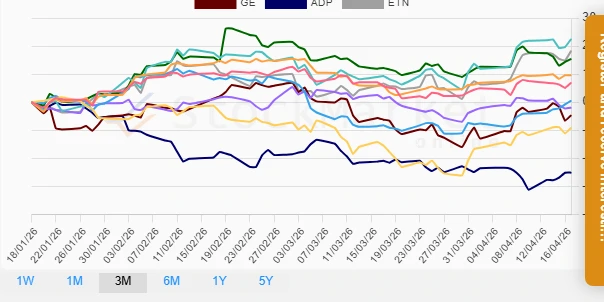
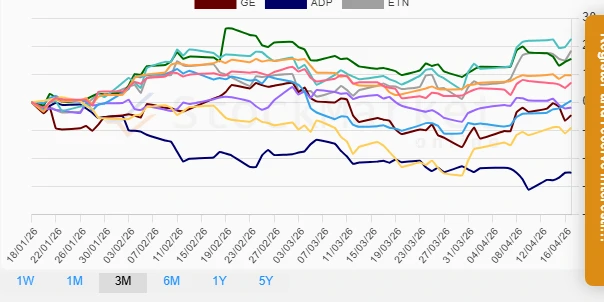
🔍 Industrial Stocks Performance Three Months
Over the three-month horizon, CAT and ETN exhibited significant growth, outperforming the sector. ADP, however, declined sharply, indicating potential strategic shifts or market realignment pressures.
| Stock | Performance (%) | Performance |
|---|---|---|
| CAT | 22.51% | |
| ETN | 18.29% | |
| DE | 15.40% | |
| UNP | 9.60% | |
| HON | 6.91% | |
| UPS | 0.53% | |
| RTX | -1.97% | |
| GE | -4.65% | |
| BA | -9.09% | |
| ADP | -25.11% |
✅ Summary
Across the varied timeframes, we observe significant performance disparities among industrial stocks. CAT consistently shows robust growth potential, while ADP's noticeable decline in the three-month period warrants close monitoring. The dynamics within this sector exemplify both opportunities and risks, suggesting diversified strategic approaches for investors.
Smart Data Insight
Master the Perfect Entry & Exit for this Stock
Don't leave your profits to chance. Historically, this stock follows specific seasonal patterns that institutional traders use to maximize returns.
- ✅ Identify the "Golden Buying Window"
- ✅ Avoid high-risk correction cycles
- ✅ Backtested data from the last 20+ years