
October 17, 2026 a 09:31 am


Industrial Stocks - Performance Analysis
The industrial sector has demonstrated varied performance behaviors over short-term and medium-term time frames. Examining the recent performance metrics provides valuable insights into sector stability and individual stock volatility. Elevated focus on both outperformers and laggards reveals trends critical for strategic positioning.
📊 Industrial Stocks Performance One Week
The past week exhibited a mix of strong performances and notable declines across industrial stocks. ADP emerged as the standout performer with an impressive growth. Conversely, CAT and ETN experienced sharp declines, indicating potential short-term volatility within specific subsectors.
| Stock | Performance (%) | Performance |
|---|---|---|
| ADP | 6.48 | |
| RTX | 4.30 | |
| UNP | 3.79 | |
| DE | 3.38 | |
| UPS | 3.05 | |
| GE | 1.82 | |
| HON | 1.77 | |
| BA | -0.05 | |
| CAT | -8.99 | |
| ETN | -9.20 |
📊 Industrial Stocks Performance One Month
Monthly analysis highlighted ADP as a persistent top performer; however, deterioration in CAT and DE is evident, reflecting potential cyclicality or sectoral headwinds. A balanced approach should consider both immediate stock recovery signals and broader sectoral shifts.
| Stock | Performance (%) | Performance |
|---|---|---|
| ADP | 6.13 | |
| HON | 2.46 | |
| UNP | 2.43 | |
| RTX | 0.43 | |
| GE | 0.26 | |
| UPS | -2.46 | |
| BA | -3.06 | |
| ETN | -4.11 | |
| DE | -6.21 | |
| CAT | -8.43 |
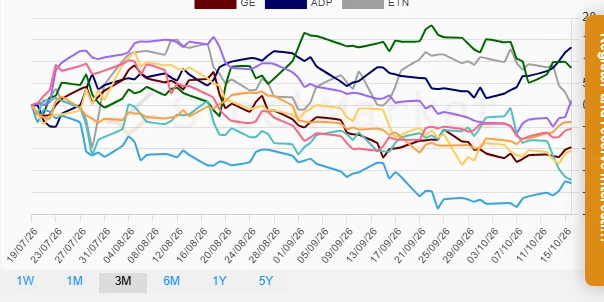
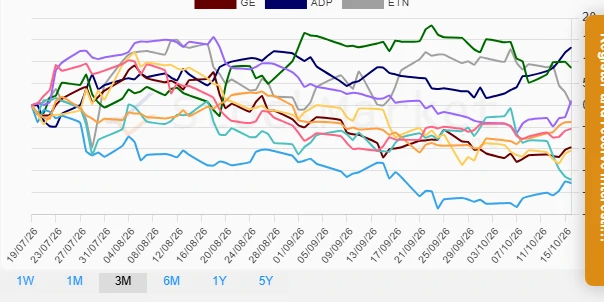
📊 Industrial Stocks Performance Three Months
Quarterly performance underscores DE and ADP as resilient amidst broader sector weaknesses. The pronounced decline in UPS and CAT stocks suggest macroeconomic pressures or company-specific challenges impacting long-term stock value.
| Stock | Performance (%) | Performance |
|---|---|---|
| ADP | 13.22 | |
| DE | 8.60 | |
| RTX | 1.02 | |
| ETN | 0.19 | |
| GE | -9.62 | |
| UNP | -3.79 | |
| HON | -5.40 | |
| BA | -10.35 | |
| CAT | -17.04 | |
| UPS | -17.82 |
✅ Summary
Overall, the industrial sector exhibits a broad spectrum of performance trends, with ADP demonstrating consistent strength and thus emerging as a potential safe harbor for investors. Conversely, the protracted declines in UPS and CAT over various periods require cautious observation and a reevaluation of strategic commitments to these stocks. For portfolio diversification, a balanced approach integrating both resilience and growth potential across different market conditions is recommended.
Smart Data Insight
Master the Perfect Entry & Exit for this Stock
Don't leave your profits to chance. Historically, this stock follows specific seasonal patterns that institutional traders use to maximize returns.
- ✅ Identify the "Golden Buying Window"
- ✅ Avoid high-risk correction cycles
- ✅ Backtested data from the last 20+ years