
May 16, 2026 a 09:31 am


Industrial Stocks - Performance Analysis
📊 The industrial sector exhibits varied performance over different time periods, reflecting broader market conditions and specific sectoral challenges. Recent data indicate significant volatility, with certain stocks dramatically outperforming while others have declined. This analysis delves into the weekly, monthly, and quarterly performance, highlighting top performers, laggards, and emerging trends to inform investment strategies.
Industrial Stocks Performance One Week
🔍 Examining the one-week performance, we observe a mixed scenario. Union Pacific Corporation (UNP) achieved the highest gain, indicating robust short-term momentum. Conversely, Boeing (BA) experienced the greatest decline, suggesting underlying challenges. Continuous monitoring is recommended to anticipate future movements.
| Stock | Performance (%) | Performance |
|---|---|---|
| UNP | 2.22 | |
| ADP | 0.78 | |
| HON | 0.11 | |
| ETN | -0.29 | |
| CAT | -0.87 | |
| UPS | -1.83 | |
| DE | -2.22 | |
| RTX | -2.77 | |
| GE | -5.31 | |
| BA | -7.16 |
Industrial Stocks Performance One Month
📈 In the past month, Caterpillar (CAT) stands out as the top performer, reflecting strong investor confidence. Raytheon Technologies (RTX) presents significant declines, suggestive of either temporary setbacks or longer-term issues. Investors should exercise caution and consider potential volatility mitigation strategies.
| Stock | Performance (%) | Performance |
|---|---|---|
| CAT | 14.84 | |
| UNP | 7.92 | |
| ADP | 7.32 | |
| ETN | 2.39 | |
| BA | 1.36 | |
| DE | -3.42 | |
| GE | -5.07 | |
| UPS | -5.17 | |
| HON | -7.00 | |
| RTX | -13.12 |
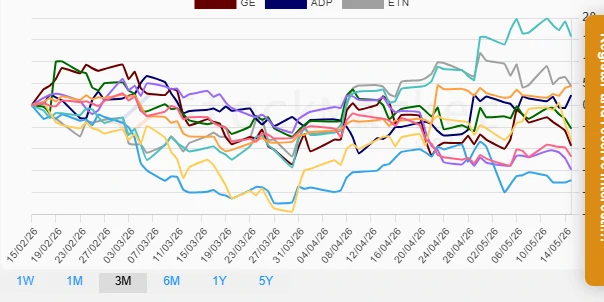
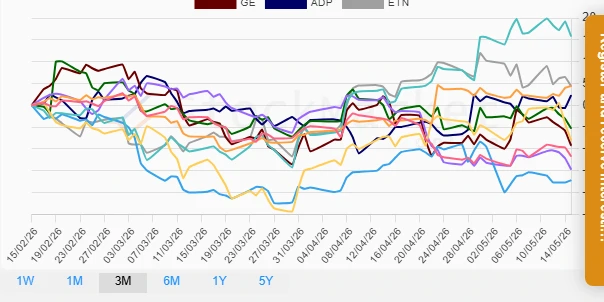
Industrial Stocks Performance Three Months
📉 The three-month analysis highlights Caterpillar (CAT) as the most favorable stock, generating substantial returns. Conversely, UPS's (-17.18%) sharp decline underscores potential red flags. It's crucial for investors to weigh long-term growth prospects against current headwinds.
| Stock | Performance (%) | Performance |
|---|---|---|
| CAT | 15.77 | |
| UNP | 4.42 | |
| ETN | 4.36 | |
| ADP | 2.32 | |
| DE | -5.32 | |
| GE | -9.25 | |
| BA | -8.04 | |
| HON | -11.72 | |
| RTX | -14.70 | |
| UPS | -17.18 |
Summary
💡 Overall, the industrial sector presents a complex landscape with both opportunities and risks. While stocks like Caterpillar (CAT) show significant strength over multiple periods, other stocks such as UPS and RTX reveal notable declines. Investors are encouraged to diversify their portfolios and stay informed about economic indicators and sector-specific news, which could influence future performance.
Smart Data Insight
Master the Perfect Entry & Exit for this Stock
Don't leave your profits to chance. Historically, this stock follows specific seasonal patterns that institutional traders use to maximize returns.
- ✅ Identify the "Golden Buying Window"
- ✅ Avoid high-risk correction cycles
- ✅ Backtested data from the last 20+ years