
November 14, 2026 a 09:31 am


Industrial Stocks - Performance Analysis 📊
The industrial sector has experienced significant volatility over recent periods, highlighting the impact of macroeconomic factors on these companies. From week-to-week fluctuations to more dramatic three-month trends, industrial stocks have shown varying degrees of resilience and vulnerability. This report delves into recent performances and identifies key patterns and insights into sector dynamics.
Industrial Stocks Performance One Week 📈
| Stock | Performance (%) | Performance |
|---|---|---|
| CAT | 7.50 | |
| RTX | 4.76 | |
| UNP | 4.19 | |
| UPS | 3.79 | |
| ETN | 3.41 | |
| GE | 2.77 | |
| ADP | 2.15 | |
| HON | 1.20 | |
| DE | 0.35 | |
| BA | -1.08 |
Industrial Stocks Performance One Month ⚖️
| Stock | Performance (%) | Performance |
|---|---|---|
| UPS | 14.38 | |
| ADP | 8.47 | |
| GE | 6.94 | |
| RTX | 6.46 | |
| HON | 5.93 | |
| UNP | 4.94 | |
| DE | 3.69 | |
| ETN | -11.19 | |
| BA | -8.75 | |
| CAT | -18.90 |
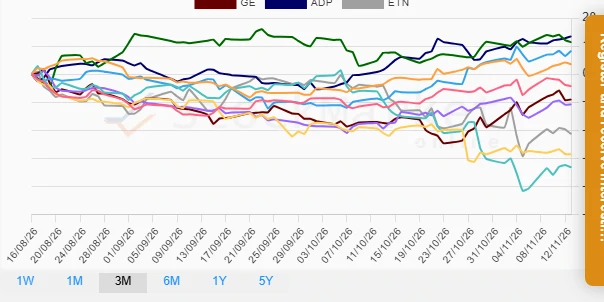
Industrial Stocks Performance Three Months 📉
| Stock | Performance (%) | Performance |
|---|---|---|
| ADP | 13.46 | |
| DE | 11.38 | |
| UPS | 8.28 | |
| UNP | 3.53 | |
| HON | -4.31 | |
| GE | -9.03 | |
| RTX | -10.78 | |
| ETN | -21.37 | |
| BA | -28.52 | |
| CAT | -33.23 |
Summary 💡
Over recent periods, the industrial sector has shown mixed results, with certain stocks exhibiting strong growth while others have faced challenges due to market conditions. The notable performance of ADP and UPS over three months suggests underlying strengths in their operational capabilities, while stocks like CAT and BA are experiencing substantial headwinds. The divergence in performance underscores the importance of sector-specific and broader economic analyses in investment strategies. Investors should remain vigilant and informed about macroeconomic indicators as they adjust their portfolios.
Smart Data Insight
Master the Perfect Entry & Exit for this Stock
Don't leave your profits to chance. Historically, this stock follows specific seasonal patterns that institutional traders use to maximize returns.
- ✅ Identify the "Golden Buying Window"
- ✅ Avoid high-risk correction cycles
- ✅ Backtested data from the last 20+ years