February 14, 2026 a 09:31 am


Industrial Stocks - Performance Analysis
📊 The industrial sector has experienced a volatile yet rewarding quarter with major players showing diverse performance metrics across different time frames. This analysis delves deep into week-by-week, month-by-month, and quarterly performances to provide insights on trends and emerging opportunities.
Industrial Stocks Performance One Week 📈
In the past week, Caterpillar Inc. (CAT) emerged as the top performer with a remarkable rise of 6.56%, while Automatic Data Processing Inc. (ADP) saw a significant decline of 8.54%. The deviation between top and bottom performers is indicative of selective sector gains.
| Stock | Performance (%) | Performance |
|---|---|---|
| CAT | 6.56 | |
| ETN | 4.18 | |
| DE | 3.43 | |
| UNP | 3.18 | |
| UPS | 1.63 | |
| HON | 1.28 | |
| RTX | 0.75 | |
| BA | 0.03 | |
| GE | -1.74 | |
| ADP | -8.54 |
Industrial Stocks Performance One Month 📈
The one-month performance saw Caterpillar Inc. again leading with an impressive surge of 18.69%. Conversely, Automatic Data Processing Inc. continued its downward trend with a notable decline of 20.06%, illustrating significant volatility within the sector.
| Stock | Performance (%) | Performance |
|---|---|---|
| CAT | 18.69 | |
| UNP | 12.63 | |
| DE | 16.11 | |
| ETN | 15.98 | |
| UPS | 9.66 | |
| HON | 11.84 | |
| RTX | 0.37 | |
| GE | -0.81 | |
| BA | -1.77 | |
| ADP | -20.06 |
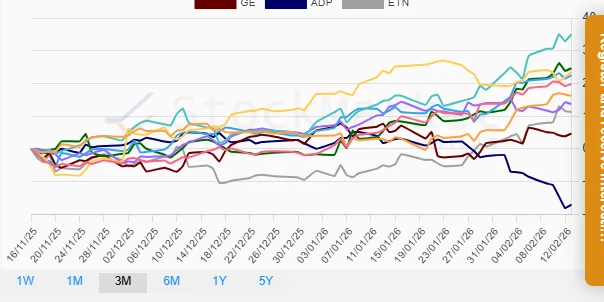
Industrial Stocks Performance Three Months 📈
Over the three-month period, CAT's dominant performance in the industrial sector is evident with a notable 34.99% gain. In contrast, ADP struggled with a 17.05% decline, suggesting varying demand dynamics and market positions.
| Stock | Performance (%) | Performance |
|---|---|---|
| CAT | 34.99 | |
| DE | 24.64 | |
| BA | 23.48 | |
| UPS | 22.49 | |
| HON | 19.83 | |
| UNP | 16.21 | |
| RTX | 13.71 | |
| ETN | 11.29 | |
| GE | 4.70 | |
| ADP | -17.05 |
Summary ✅
The industrial sector has shown mixed signals across the evaluated periods, with Caterpillar holding a consistent top-performing status, whereas Automatic Data Processing depicted a consistently negative trajectory. Future investment decisions should consider both the volatility and historical performance while anticipating potential market catalysts that may influence industrial stock dynamics.
Smart Data Insight
Master the Perfect Entry & Exit for this Stock
Don't leave your profits to chance. Historically, this stock follows specific seasonal patterns that institutional traders use to maximize returns.
- ✅ Identify the "Golden Buying Window"
- ✅ Avoid high-risk correction cycles
- ✅ Backtested data from the last 20+ years