
June 13, 2026 a 09:31 am


Industrial Stocks - Performance Analysis
In today's dynamic financial landscape, the industrial sector continues to display resilience and volatility across different timeframes. Our comprehensive analysis evaluates the performance of leading industrial stocks, highlighting top performers and underperformers. The analysis aims to provide insights into market trends and potential investment opportunities. 📊 Let us delve into the recent data and uncover the factors driving these changes.
Industrial Stocks Performance One Week
The one-week time frame reveals notable fluctuations among industrial stocks, with Honeywell (HON) leading with a respectable performance of 3.25%, followed by General Electric (GE) and Boeing (BA). Meanwhile, Automatic Data Processing (ADP) faces the biggest challenge, registering a decline of 2.48%. This short-term volatility may present tactical trading opportunities. 🗣️
| Stock | Performance (%) | Performance |
|---|---|---|
| HON | 3.25 | |
| GE | 2.41 | |
| BA | 1.88 | |
| RTX | 1.50 | |
| CAT | 1.04 | |
| UNP | 0.18 | |
| UPS | -0.17 | |
| ETN | -0.80 | |
| DE | -0.95 | |
| ADP | -2.48 |
Industrial Stocks Performance One Month
On a monthly scale, General Electric (GE) took the lead with a 14.60% surge. United Parcel Service (UPS) and Automatic Data Processing (ADP) also posted strong gains, highlighting positive market sentiment. Conversely, Boeing (BA) faced headwinds, dropping 3.88%. This period exhibits broader industrial robustness, albeit with specific setbacks. 📉
| Stock | Performance (%) | Performance |
|---|---|---|
| GE | 14.60 | |
| UPS | 9.86 | |
| ADP | 8.61 | |
| RTX | 4.73 | |
| HON | 1.84 | |
| UNP | 1.58 | |
| DE | 1.02 | |
| CAT | -0.26 | |
| ETN | -3.32 | |
| BA | -3.88 |
Industrial Stocks Performance Three Months
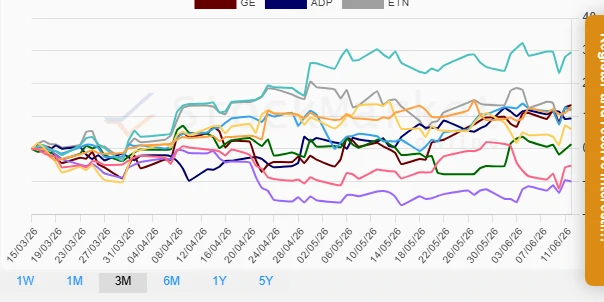
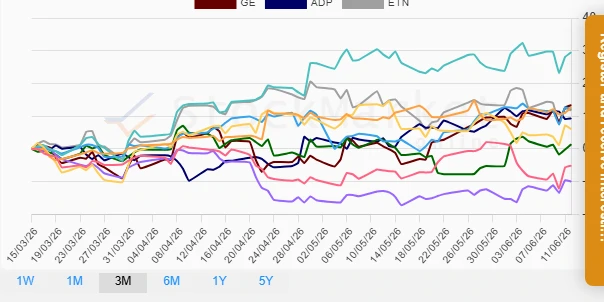
In the longer three-month horizon, Caterpillar (CAT) dominates with a significant 29.54% increase, indicating strong industry fundamentals and potential market confidence. Unilever (UNP) and General Electric (GE) also demonstrated robustness. However, Raytheon Technologies (RTX) experienced a downturn of 9.93%. This period highlights significant shifts and market responsiveness. ✅
| Stock | Performance (%) | Performance |
|---|---|---|
| CAT | 29.54 | |
| GE | 13.39 | |
| UNP | 12.67 | |
| UPS | 12.16 | |
| ADP | 9.32 | |
| ETN | 11.80 | |
| BA | 6.05 | |
| DE | 1.39 | |
| HON | -5.10 | |
| RTX | -9.93 |
Summary
In summary, industrial stocks exhibit a diverse range of performances influenced by market conditions and sector-specific factors. The variance over week, month, and three-month periods highlights strategic investment prospects and potential underlying risks. Investors should exercise due diligence, considering macroeconomic indicators and company fundamentals before making informed decisions. 🏆
Smart Data Insight
Master the Perfect Entry & Exit for this Stock
Don't leave your profits to chance. Historically, this stock follows specific seasonal patterns that institutional traders use to maximize returns.
- ✅ Identify the "Golden Buying Window"
- ✅ Avoid high-risk correction cycles
- ✅ Backtested data from the last 20+ years