
October 11, 2025 a 09:31 am



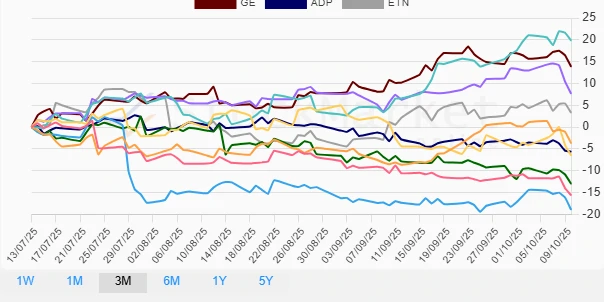
📊 Industrial Stocks - Performance Analysis
The past periods have showcased varied performance across the industrial sector with significant divergences in stock momentum. Amidst global economic shifts, certain industrial players have demonstrated resilience, while others confronted headwinds. This analysis provides a detailed examination of weekly, monthly, and quarterly performance, unveiling top performers, underperformers, and emerging trends.
📈 Industrial Stocks Performance One Week
| Stock | Performance (%) | Performance |
|---|---|---|
| ETN | -1.10 | |
| CAT | -1.24 | |
| GE | -1.83 | |
| ADP | -2.09 | |
| BA | -2.46 | |
| DE | -3.58 | |
| HON | -3.92 | |
| UPS | -4.56 | |
| UNP | -4.85 | |
| RTX | -5.35 |
📉 Industrial Stocks Performance One Month
| Stock | Performance (%) | Performance |
|---|---|---|
| CAT | 13.26 | |
| UNP | 4.39 | |
| GE | 3.67 | |
| ETN | 2.73 | |
| RTX | 0.22 | |
| UPS | -1.99 | |
| DE | -6.41 | |
| HON | -6.84 | |
| ADP | -4.33 | |
| BA | -4.00 |
📈 Industrial Stocks Performance Three Months
| Stock | Performance (%) | Performance |
|---|---|---|
| CAT | 19.80 | |
| GE | 13.81 | |
| RTX | 7.64 | |
| ETN | 3.27 | |
| UNP | -3.72 | |
| ADP | -5.64 | |
| BA | -6.55 | |
| DE | -13.01 | |
| HON | -15.63 | |
| UPS | -18.96 |
✅ Summary
The analysis reflects a mixed performance landscape within the industrial sector over the observed periods. Caterpillar (CAT) stands out as a formidable performer, especially over the three months, capitalizing on robust demand and strategic positioning. On the contrary, UPS faces significant challenges attributable to market and operational factors, impacting its stock value negatively. Investors should keenly observe the sector's movements, focusing on diversified portfolio strategies to mitigate risk. Overall, while resilience marks the sector, vigilance remains critical amidst evolving economic indicators.
Smart Data Insight
Master the Perfect Entry & Exit for this Stock
Don't leave your profits to chance. Historically, this stock follows specific seasonal patterns that institutional traders use to maximize returns.
- ✅ Identify the "Golden Buying Window"
- ✅ Avoid high-risk correction cycles
- ✅ Backtested data from the last 20+ years