
July 11, 2026 a 09:31 am


Industrial Stocks - Performance Analysis
In recent weeks, the industrial sector has displayed varying dynamics, with strong performances in some stocks counteracted by notable downturns in others. The following analysis provides a comprehensive view of industrial sector movements, shedding light on the top performers and underperformers over the past week, month, and three months. This analysis helps to identify trends and offers insights into the broader market dynamics driving these changes.
📊 Industrial Stocks Performance One Week
Over the past week, Eaton Corporation (ETN) emerged as the top performer, showcasing a growth of 2.36%, followed closely by Union Pacific Corporation (UNP) and United Parcel Service (UPS) with increases of 1.67%. Conversely, Deere & Company (DE) faced a significant dip of -5.53%, marking it the period's underperformer. This suggests a potentially volatile short-term market environment.
| Stock | Performance (%) | Performance |
|---|---|---|
| ETN | 2.36 | |
| UNP | 1.67 | |
| UPS | 1.67 | |
| ADP | -0.09 | |
| CAT | -1.09 | |
| HON | -1.43 | |
| RTX | -1.64 | |
| BA | -1.76 | |
| GE | -4.85 | |
| DE | -5.53 |
📊 Industrial Stocks Performance One Month
In the one-month span, General Electric (GE) marked a leading upswing with 7.92%, indicating robust recovery across its operational segments. Caterpillar (CAT) and Automatic Data Processing (ADP) also recorded strong performances, exceeding 7% growth. The general one-month performance denotes a positive market sentiment for industrial leaders.
| Stock | Performance (%) | Performance |
|---|---|---|
| GE | 7.92 | |
| ADP | 7.29 | |
| CAT | 7.01 | |
| UNP | 6.96 | |
| RTX | 6.50 | |
| ETN | 4.40 | |
| UPS | 3.73 | |
| DE | 3.58 | |
| HON | 3.58 | |
| BA | 0.63 |
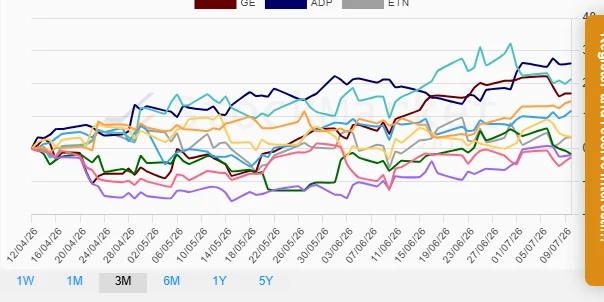
📊 Industrial Stocks Performance Three Months
The past three months provided an impressive narrative for Automatic Data Processing (ADP), which achieved the highest growth at 26.14%. Caterpillar (CAT) and General Electric (GE) followed with significant upward momentum. On the other hand, Honeywell International (HON) experienced a slight dip of -2.49%, pointing to diverse market conditions influencing these stocks.
| Stock | Performance (%) | Performance |
|---|---|---|
| ADP | 26.14 | |
| CAT | 21.37 | |
| GE | 16.97 | |
| UNP | 14.61 | |
| UPS | 11.68 | |
| BA | 3.68 | |
| ETN | 3.60 | |
| DE | -1.56 | |
| RTX | -1.79 | |
| HON | -2.49 |
✅ Summary
Over the recent periods, the industrial stocks have exhibited a varied performance pattern. Despite some short-term dips, notably in Deere & Company for the last week, the overall sentiment remains positive when considering the month and three-month perspectives. The standout performers—General Electric, Caterpillar, and Automatic Data Processing—highlight growth opportunities in innovation and infrastructure investments. Investors might want to consider these insights for strategic positioning as market conditions continue to evolve.
Smart Data Insight
Master the Perfect Entry & Exit for this Stock
Don't leave your profits to chance. Historically, this stock follows specific seasonal patterns that institutional traders use to maximize returns.
- ✅ Identify the "Golden Buying Window"
- ✅ Avoid high-risk correction cycles
- ✅ Backtested data from the last 20+ years