June 07, 2025 a 09:31 am


Industrial Stocks - Performance Analysis
The industrial sector remains a cornerstone of the global economy, with varying performance across time periods. Recent data indicates diverse trends in stock performance, influenced by macroeconomic factors and internal company developments. Our analysis provides insights into the recent performance of major industrial stocks over one week, one month, and three months, offering valuable information for investors seeking to optimize their portfolio allocation in this sector.
📊 Industrial Stocks Performance One Week
| Stock | Performance (%) | Performance |
|---|---|---|
| GE | 3.89% | |
| ETN | 3.49% | |
| DE | 2.70% | |
| RTX | 1.91% | |
| BA | 1.70% | |
| CAT | 1.53% | |
| HON | 0.93% | |
| UNP | 0.82% | |
| UPS | 0.76% | |
| ADP | 0.39% |
📊 Industrial Stocks Performance One Month
| Stock | Performance (%) | Performance |
|---|---|---|
| GE | 17.74% | |
| BA | 9.68% | |
| CAT | 8.85% | |
| RTX | 7.95% | |
| ETN | 7.87% | |
| HON | 6.54% | |
| ADP | 6.29% | |
| DE | 6.14% | |
| UNP | 3.30% | |
| UPS | 1.68% |
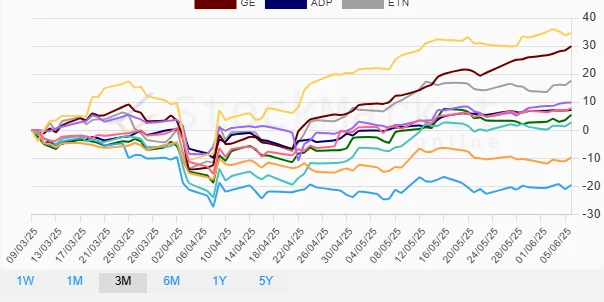
📊 Industrial Stocks Performance Three Months
| Stock | Performance (%) | Performance |
|---|---|---|
| BA | 34.72% | |
| GE | 29.94% | |
| ETN | 17.59% | |
| RTX | 9.84% | |
| HON | 7.83% | |
| ADP | 7.22% | |
| DE | 5.44% | |
| CAT | 2.72% | |
| UNP | -9.77% | |
| UPS | -19.56% |
Summary
The industrial sector has witnessed significant variability in performance across various time periods. Companies like General Electric (GE) and Boeing (BA) have consistently outperformed, reflecting strong market positions and investor confidence. Meanwhile, UPS has shown signs of underperformance in the longer three-month period, suggesting potential underlying challenges. Investors should remain vigilant, considering both macroeconomic indicators and sector-specific dynamics when making strategic investment decisions. Balancing portfolios with a mix of high-performing stocks such as GE and BA with potential growth stocks could offer an optimal risk-return tradeoff.
Smart Data Insight
Master the Perfect Entry & Exit for this Stock
Don't leave your profits to chance. Historically, this stock follows specific seasonal patterns that institutional traders use to maximize returns.
- ✅ Identify the "Golden Buying Window"
- ✅ Avoid high-risk correction cycles
- ✅ Backtested data from the last 20+ years