December 06, 2025 a 09:31 am


Industrial Stocks - Performance Analysis
📊 Analyzing the performance of major industrial stocks provides crucial insights into market dynamics and investor sentiment. This report evaluates their performance over one week, one month, and three months, identifying key trends and drivers influencing these movements. Understanding these metrics aids investors in formulating informed decisions within the industrial sector.
Industrial Stocks Performance One Week
📈 During the past week, Boeing (BA) emerged as the top performer with a significant rise of 7.11%, indicating strong investor confidence in the aerospace sector. Meanwhile, General Electric (GE) experienced the largest decline, falling by 4.88%, suggesting potential headwinds in its operations or market conditions. Overall, the sector displayed mixed performance, reflecting diverse underlying factors driving individual stock movements.
| Stock | Performance (%) | Performance |
|---|---|---|
| BA | 7.11 | |
| CAT | 4.72 | |
| ADP | 2.45 | |
| DE | 2.31 | |
| UNP | 1.52 | |
| UPS | -0.86 | |
| HON | -0.43 | |
| RTX | -2.11 | |
| ETN | -2.36 | |
| GE | -4.88 |
Industrial Stocks Performance One Month
📉 Over the past month, Union Pacific (UNP) recorded a robust performance with a 7.75% increase, suggesting favorable conditions in railway logistics. Conversely, Eaton (ETN) underperformed significantly with a 10.68% decline, possibly due to increased costs or supply chain disruptions. Such divergent trends indicate volatility and varied economic impacts across the industrial sector.
| Stock | Performance (%) | Performance |
|---|---|---|
| UNP | 7.75 | |
| CAT | 5.91 | |
| ADP | 3.67 | |
| BA | 3.39 | |
| UPS | 1.73 | |
| DE | 0.27 | |
| HON | -2.25 | |
| RTX | -2.13 | |
| GE | -6.98 | |
| ETN | -10.68 |
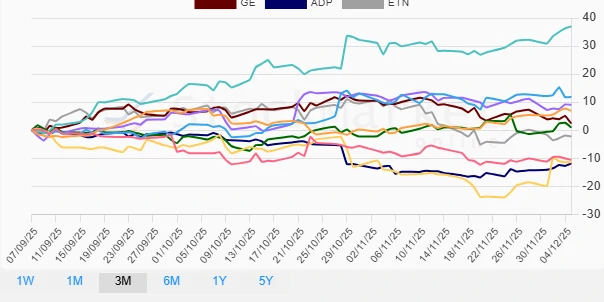
Industrial Stocks Performance Three Months
📈 Over the last quarter, Caterpillar (CAT) showcased remarkable performance with a 36.98% surge, possibly attributed to increased infrastructure investment and robust global demand. In stark contrast, Automatic Data Processing (ADP) faced the steepest decline of 11.85%, reflecting potential challenges in labor markets or competitive pressures. This variance illustrates how macroeconomic factors and sector-specific developments impact stock performance.
| Stock | Performance (%) | Performance |
|---|---|---|
| CAT | 36.98 | |
| UPS | 11.91 | |
| RTX | 9.08 | |
| UNP | 6.93 | |
| GE | 2.40 | |
| DE | 1.00 | |
| ETN | -2.21 | |
| HON | -10.54 | |
| BA | -11.39 | |
| ADP | -11.85 |
Summary
✅ In conclusion, the industrial sector exhibits substantial variations in stock performance over different periods, driven by macroeconomic factors and sector-specific developments. Boeing's strong weekly performance highlights resilience in aerospace, while Caterpillar's impressive quarterly gains underscore robust infrastructure demands. Investors should remain vigilant about macro and microeconomic influences when making investment decisions within this dynamic sector.