
September 05, 2026 a 09:31 am


Industrial Stocks - Performance Analysis
Over the past reporting periods, the industrial sector has demonstrated notable volatility with a mix of both positive advances and significant declines. This variability across different time spans suggests differing levels of investor confidence and external economic influences affecting these stocks. Our analysis will delve into these patterns, identifying top performers and laggards to better understand the sector's current landscape.
📊 Industrial Stocks Performance One Week
| Stock | Performance (%) | Performance |
|---|---|---|
| DE | 9.73 | |
| ETN | 2.10 | |
| CAT | 1.74 | |
| BA | 1.19 | |
| GE | -1.57 | |
| UPS | -2.90 | |
| ADP | -3.45 | |
| HON | -3.60 | |
| RTX | -5.24 | |
| UNP | -5.88 |
📊 Industrial Stocks Performance One Month
| Stock | Performance (%) | Performance |
|---|---|---|
| DE | 12.67 | |
| ADP | 1.68 | |
| UPS | -0.76 | |
| UNP | -1.82 | |
| CAT | -4.83 | |
| ETN | -8.21 | |
| BA | -8.84 | |
| GE | -10.11 | |
| RTX | -10.41 | |
| HON | -13.47 |
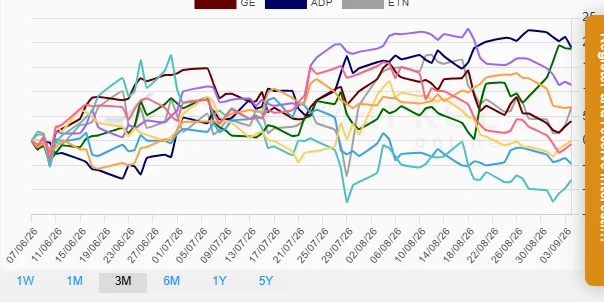
📊 Industrial Stocks Performance Three Months
| Stock | Performance (%) | Performance |
|---|---|---|
| ADP | 19.06 | |
| DE | 18.73 | |
| RTX | 11.37 | |
| UNP | 6.84 | |
| ETN | 6.65 | |
| GE | 3.99 | |
| UPS | -4.69 | |
| HON | -0.72 | |
| BA | -0.02 | |
| CAT | -8.00 |
📈 Summary
Analyzing the industrial sector's performance over various timeframes reveals that while there are standout performers like Deere & Company and ADP, driven potentially by sector-specific growth factors, several stocks have faced headwinds. Notably, Honeywell emerged as a consistent underperformer, potentially resulting from internal or broader market challenges. Investors should be cautious of stocks with continuous downward trends and consider the sector's potential for growth amidst broader economic conditions. An emphasis on diversification within the industrial sector is advisable to mitigate risks associated with its inherent volatility.
Smart Data Insight
Master the Perfect Entry & Exit for this Stock
Don't leave your profits to chance. Historically, this stock follows specific seasonal patterns that institutional traders use to maximize returns.
- ✅ Identify the "Golden Buying Window"
- ✅ Avoid high-risk correction cycles
- ✅ Backtested data from the last 20+ years