October 04, 2025 a 09:31 am


Industrial Stocks - Performance Analysis
This comprehensive analysis of the largest stocks in the industrial sector evaluates their performance over different short-term timeframes. By delving into one-week, one-month, and three-month periods, we can identify trends, assess volatility, and ultimately guide investment strategies.
Industrial Stocks Performance One Week 📊
| Stock | Performance (%) | Performance |
|---|---|---|
| CAT | 6.71 | |
| UPS | 3.62 | |
| ETN | 2.15 | |
| GE | 0.71 | |
| UNP | 0.69 | |
| RTX | 1.98 | |
| HON | 0.41 | |
| BA | -2.24 | |
| DE | -0.20 | |
| ADP | -0.07 |
Industrial Stocks Performance One Month 📊
| Stock | Performance (%) | Performance |
|---|---|---|
| CAT | 17.15 | |
| ETN | 7.26 | |
| GE | 5.30 | |
| UNP | 6.06 | |
| RTX | 5.00 | |
| UPS | 2.77 | |
| DE | -2.48 | |
| HON | -2.83 | |
| ADP | -3.24 | |
| BA | -6.25 |
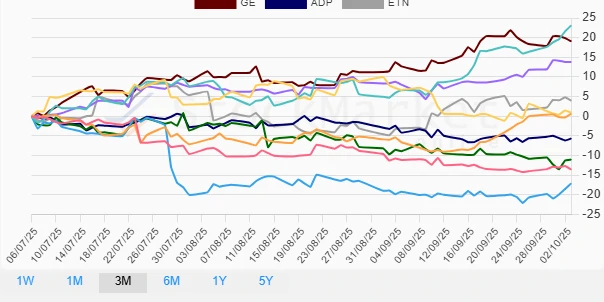
Industrial Stocks Performance Three Months 📊
| Stock | Performance (%) | Performance |
|---|---|---|
| CAT | 23.09 | |
| RTX | 13.77 | |
| GE | 19.07 | |
| ETN | 3.94 | |
| BA | 0.92 | |
| UNP | 0.65 | |
| ADP | -5.69 | |
| DE | -11.04 | |
| HON | -13.58 | |
| UPS | -17.10 |
Summary 🗣️
Across multiple timeframes, Caterpillar Inc. (CAT) consistently emerges as a top-performing stock, demonstrating notable resilience and strength in the industrial sector. In contrast, stocks like Boeing Co. (BA) and United Parcel Service (UPS) exhibit more volatile and weaker performances, underscoring potential challenges and market concerns. This analysis suggests that investors might focus on fundamentally strong companies like CAT and monitor underperforming stocks for potential turnaround opportunities or ongoing risks.
Smart Data Insight
Master the Perfect Entry & Exit for this Stock
Don't leave your profits to chance. Historically, this stock follows specific seasonal patterns that institutional traders use to maximize returns.
- ✅ Identify the "Golden Buying Window"
- ✅ Avoid high-risk correction cycles
- ✅ Backtested data from the last 20+ years