May 02, 2026 a 09:31 am


Industrial Stocks - Performance Analysis
📊 The following financial analysis presents the recent performance overview of major industrial stocks over three distinct periods: 1 week, 1 month, and 3 months. Each period showcases varied investor sentiment and market dynamics, providing insights into short-term trends and potential long-term implications. This analysis identifies both high-flyers and laggards, critical for making informed investment decisions.
Industrial Stocks Performance One Week
| Stock | Performance (%) | Performance |
|---|---|---|
| ADP | 8.94 | |
| CAT | 7.31 | |
| DE | 2.74 | |
| GE | 0.73 | |
| UPS | 0.67 | |
| ETN | 0.55 | |
| RTX | -0.10 | |
| HON | -0.29 | |
| UNP | -0.86 | |
| BA | -2.13 |
Industrial Stocks Performance One Month
| Stock | Performance (%) | Performance |
|---|---|---|
| CAT | 22.40 | |
| ETN | 16.88 | |
| BA | 9.24 | |
| UPS | 9.40 | |
| UNP | 8.91 | |
| ADP | 5.41 | |
| GE | 2.67 | |
| DE | 0.89 | |
| HON | -7.40 | |
| RTX | -11.66 |
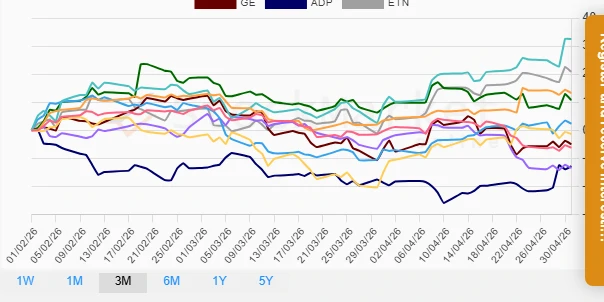
Industrial Stocks Performance Three Months
| Stock | Performance (%) | Performance |
|---|---|---|
| CAT | 32.53 | |
| ETN | 20.82 | |
| UNP | 13.27 | |
| DE | 10.77 | |
| UPS | 2.31 | |
| BA | -1.32 | |
| HON | -6.22 | |
| GE | -4.95 | |
| ADP | -12.84 | |
| RTX | -13.46 |
Summary
🔍 Over the evaluated periods, Caterpillar Inc. (CAT) emerges consistently as the top performer, especially during the 3-month interval with a notable 32.53% increase, indicating robust market positioning. While several stocks like ADP and GE showed volatile one-week performances, their longer timelines reflect steadiness. Conversely, RTX underperformed in both short and extended periods, signalling potential underlying challenges. Investors might consider leveraging CAT's upward trend, whereas prudent caution is advised for RTX till further data substantiates its recovery trajectory.
Smart Data Insight
Master the Perfect Entry & Exit for this Stock
Don't leave your profits to chance. Historically, this stock follows specific seasonal patterns that institutional traders use to maximize returns.
- ✅ Identify the "Golden Buying Window"
- ✅ Avoid high-risk correction cycles
- ✅ Backtested data from the last 20+ years