
August 01, 2026 a 09:31 am


Industrial Stocks - Performance Analysis
📊 The industrial sector has demonstrated varied performance metrics over the recent periods, reflecting both resilience and volatility amidst continuous market fluctuations. This analysis aims to decode these movements, identifying both top performers and underperformers across different timeframes, whilst providing insights into overarching trends that influence these shifts.
Industrial Stocks Performance One Week
🔍 Over the past week, the industrial sector stocks exhibited a diverse performance spectrum with ADP leading the pack with a substantial gain, while UPS suffered a pronounced decline. The short-term trends suggest selective investor confidence, possibly influenced by recent macroeconomic announcements and sector-specific news.
| Stock | Performance (%) | Performance |
|---|---|---|
| ADP | 6.54% | |
| ETN | 3.47% | |
| BA | 3.37% | |
| GE | 1.90% | |
| RTX | 1.19% | |
| HON | 0.00% | |
| DE | -5.66% | |
| UNP | -5.01% | |
| CAT | -8.28% | |
| UPS | -9.41% |
Industrial Stocks Performance One Month
📈 Over the month-long period, ADP outperformed its peers significantly, while CAT notably underperformed. The variations in performance could be tied to sectoral shifts and macroeconomic conditions, indicating potential rotation and investor sentiment reflecting changing economic expectations.
| Stock | Performance (%) | Performance |
|---|---|---|
| ADP | 10.04% | |
| RTX | 8.09% | |
| HON | 5.92% | |
| ETN | 5.25% | |
| UNP | 3.71% | |
| DE | -4.26% | |
| GE | -4.33% | |
| BA | -4.16% | |
| UPS | -5.50% | |
| CAT | -16.10% |
Industrial Stocks Performance Three Months
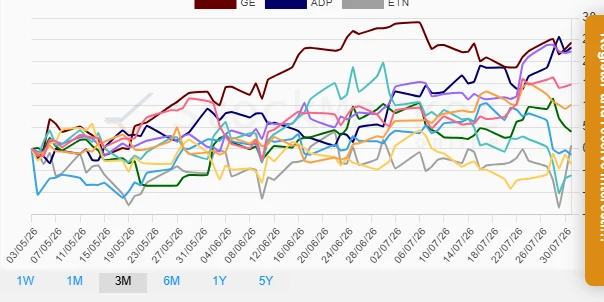
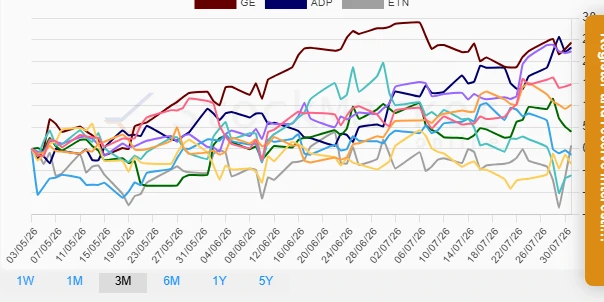
📉 The three-month performance showcases significant gains for GE and RTX, with substantial underperformance from CAT. Such performance disparities hint at strategic investor positioning and sector-specific influences, potentially reflecting broader economic momentum.
| Stock | Performance (%) | Performance |
|---|---|---|
| GE | 24.33% | |
| RTX | 22.34% | |
| ADP | 23.21% | |
| HON | 14.78% | |
| UNP | 10.10% | |
| DE | 3.97% | |
| ETN | 0.77% | |
| UPS | -1.31% | |
| BA | -3.44% | |
| CAT | -6.06% |
Summary
💡 The analysis indicates diverse performance across different time frames, with ADP, RTX, and GE consistently delivering strong results, while CAT has faced significant challenges. The results suggest a potential for tactical sector rotation from investors, leveraging the strengths displayed by leading stocks. Despite some short-term fluctuations, the longer-term trends reflect strategic resilience and positioning amidst broader market dynamics. Investors should continue to monitor macroeconomic trends and their impact on sector-specific drivers.
Smart Data Insight
Master the Perfect Entry & Exit for this Stock
Don't leave your profits to chance. Historically, this stock follows specific seasonal patterns that institutional traders use to maximize returns.
- ✅ Identify the "Golden Buying Window"
- ✅ Avoid high-risk correction cycles
- ✅ Backtested data from the last 20+ years