May 23, 2026 a 04:03 am
IVZ: Trend and Support & Resistance Analysis - Invesco Ltd.
Invesco Ltd. has shown a diverse approach in investment strategies, managing portfolios across various asset classes globally. With its long-standing experience, it attracts a wide client base, including institutional and retail investors. The analysis presented here focuses on recent stock movements to help investors understand current trends and potential support and resistance zones.
Trend Analysis
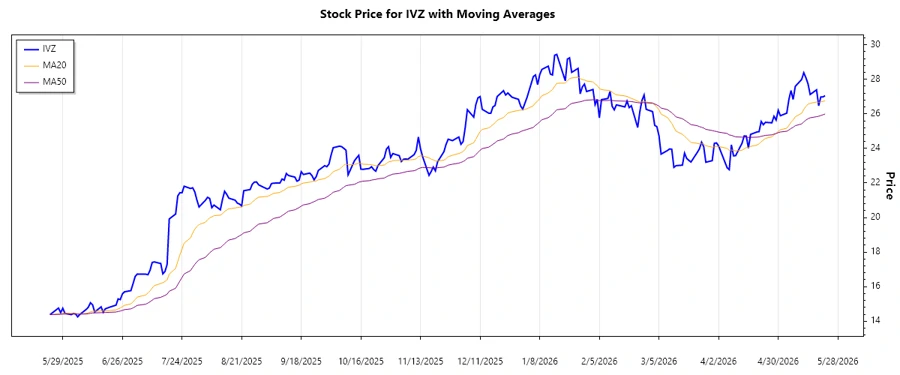
The recent stock performance of Invesco Ltd. indicates a notable trend. The calculation of the 20-day and 50-day exponential moving averages (EMA) shows:
| Date | Closing Price | Trend |
|---|---|---|
| 2026-05-22 | $27.05 | ▲ Uptrend |
| 2026-05-21 | $26.98 | ▲ Uptrend |
| 2026-05-20 | $26.98 | ▲ Uptrend |
| 2026-05-19 | $26.47 | ▲ Uptrend |
| 2026-05-18 | $27.39 | ▲ Uptrend |
| 2026-05-15 | $27.12 | ▲ Uptrend |
| 2026-05-14 | $27.73 | ▲ Uptrend |
The trend analysis confirms a strong uptrend as the EMA20 > EMA50, suggesting increasing buying momentum.
Support and Resistance
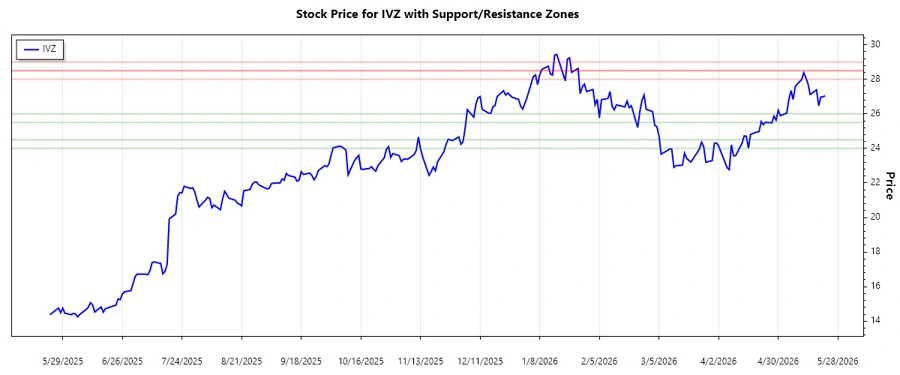
Upon evaluating the stock's historical performance:
| Type | From | To |
|---|---|---|
| Support Zone 1 | $25.50 | $26.00 |
| Support Zone 2 | $24.00 | $24.50 |
| Resistance Zone 1 | $28.00 | $28.50 |
| Resistance Zone 2 | $28.50 | $29.00 |
Currently, the stock price is approaching the lower boundary of the first resistance zone, indicating potential selling pressure or a breakout opportunity.
Conclusion
In conclusion, Invesco Ltd. is experiencing a significant uptrend with a potential to test and possibly break resistance levels. This movement aligns with strong market interest and institutional confidence. Investors should watch for a breakout above the resistance zones to confirm bullish momentum, while also being aware of support levels for potential entry points. The diversified investment approach of Invesco adds a layer of stability amidst market volatility, but investors should remain cautious of macroeconomic factors that may affect asset management portfolios.
Smart Data Insight
Master the Perfect Entry & Exit for this Stock
Don't leave your profits to chance. Historically, this stock follows specific seasonal patterns that institutional traders use to maximize returns.
- ✅ Identify the "Golden Buying Window"
- ✅ Avoid high-risk correction cycles
- ✅ Backtested data from the last 20+ years