March 13, 2026 a 03:15 am

IVZ: Trend and Support & Resistance Analysis - Invesco Ltd.
Invesco Ltd., a prominent investment manager from Atlanta, Georgia, provides a diverse range of financial services to a broad clientele. Recent analysis of its stock indicates a strong presence in equity, fixed income, and alternative markets. However, the recent decline in stock prices suggests volatile market conditions, warranting caution among investors. This analysis aims to outline the trend and critical support & resistance zones for informed decision-making.
Trend Analysis
| Date | Closing Price | Trend |
|---|---|---|
| 2026-03-12 | $22.90 | ▼ |
| 2026-03-11 | $23.95 | ▼ |
| 2026-03-10 | $23.97 | ▲ |
| 2026-03-09 | $23.88 | ▼ |
| 2026-03-06 | $23.67 | ▼ |
| 2026-03-05 | $24.73 | ▲ |
| 2026-03-04 | $25.26 | ▲ |
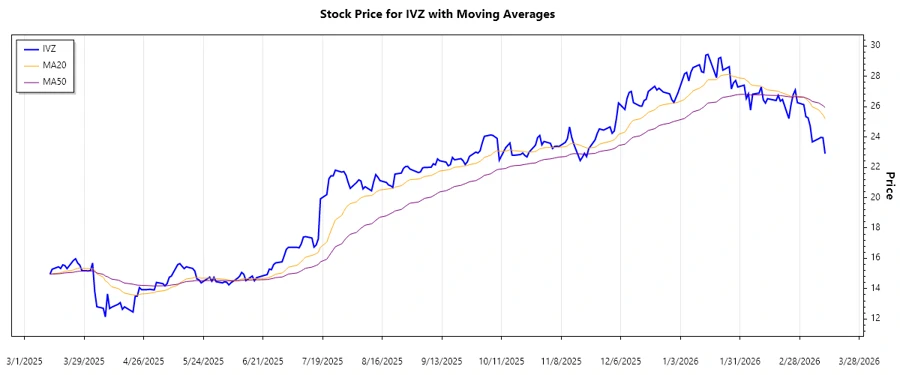
In recent trading sessions, the stock of Invesco Ltd. has demonstrated a downward trend primarily. Despite some intermittent upward movements, the EMA20 remains consistently below the EMA50, indicating a predominant bearish sentiment.
Support and Resistance
| Zone Type | From | To |
|---|---|---|
| Support Zone 1 | 21.00 | 21.50 |
| Support Zone 2 | 22.00 | 22.50 |
| Resistance Zone 1 | 24.00 | 24.50 |
| Resistance Zone 2 | 25.00 | 25.50 |
Currently, the stock is hovering around the upper boundary of the second support zone, though below the resistance levels, indicating selling pressure as it approaches significant barriers.
Conclusion
Invesco Ltd.'s stock demonstrates bearish tendencies in a volatile market environment, with resistance levels underscoring potential upside obstacles. Market participants should carefully weigh the revealed support zones for entry points while noting the resistance levels as potential exit points or for stop-loss adjustments. The analysis highlights the importance of cautious trading, given the volatility and identified trend.