June 01, 2025 a 08:15 am

IVZ: Trend and Support & Resistance Analysis - Invesco Ltd.
Invesco Ltd. has shown varying performance over the examined period. With its diverse investment strategies spanning equities, fixed income, and alternative markets, the company is poised for both opportunities and risks. The current trend analysis suggests a possible shift in momentum. Understanding these market signals is crucial for investors aiming to capitalize on potential movements.
Trend Analysis
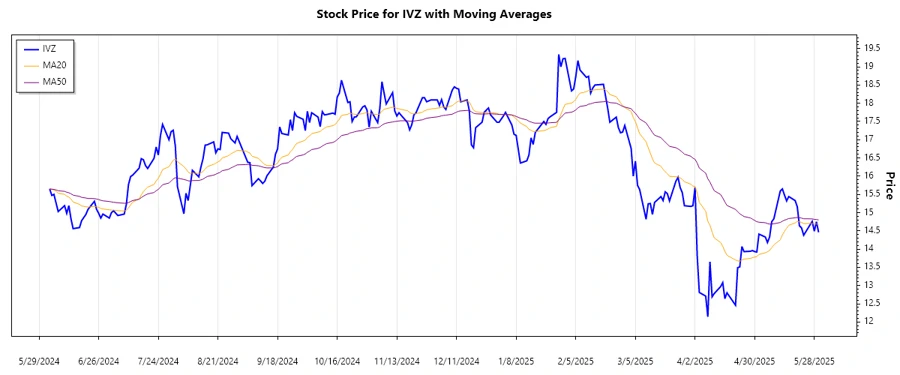
The closing prices of Invesco Ltd. over recent months indicate fluctuations in market sentiment. Calculating the 20-day and 50-day Exponential Moving Averages (EMA), we determine the market trend direction.
| Date | Close Price | Trend |
|---|---|---|
| 2025-05-30 | 14.46 | ⚖️ Sideways |
| 2025-05-29 | 14.75 | ⚖️ Sideways |
| 2025-05-28 | 14.49 | ▼ Down |
| 2025-05-27 | 14.76 | ▲ Up |
| 2025-05-23 | 14.38 | ▼ Down |
| 2025-05-22 | 14.58 | ▲ Up |
| 2025-05-21 | 14.64 | ▲ Up |
The recent trend suggests a mix of upward and downward movements. However, with EMA20 nearing EMA50, a neutral trend is predominant.
Support- and Resistance
By analyzing recent closing prices, critical support and resistance zones can be identified.
| Zone Type | From | To |
|---|---|---|
| Support Zone 1 | 13.50 | 13.80 |
| Support Zone 2 | 14.00 | 14.30 |
| Resistance Zone 1 | 14.80 | 15.10 |
| Resistance Zone 2 | 15.80 | 16.10 |
The current price is entering the lower bounds of the resistance zone, suggesting potential challenges for further upward movement.
Conclusion
Analyzing the given data, Invesco Ltd. displays a neutral overall trend, with EMA values close in range. Investors should remain vigilant for any breakout from identified zones. While the stock approaches resistance levels, any upward surge could present a buying opportunity whereas revisiting support levels may indicate a potential sell-point. This technical assessment, combined with Invesco's varied investment offerings, suggests both short-term risks and long-term opportunities. Key market developments and financial trends should guide strategic investment decisions.
Smart Data Insight
Master the Perfect Entry & Exit for this Stock
Don't leave your profits to chance. Historically, this stock follows specific seasonal patterns that institutional traders use to maximize returns.
- ✅ Identify the "Golden Buying Window"
- ✅ Avoid high-risk correction cycles
- ✅ Backtested data from the last 20+ years