November 07, 2025 a 06:45 am
IVZ: Fibonacci Analysis - Invesco Ltd.
Invesco Ltd. has shown a remarkable upward trend over the past few months, supported by its diversified investment strategies. As a prominent player in the investment management sector, its ability to launch and manage a wide array of funds caters to various client needs. Despite market fluctuations, Invesco Ltd. continues to leverage quantitative analysis to optimize its portfolio. Investors should watch for key technical levels that might indicate potential entry or exit points.
Fibonacci Analysis
| Detail | Value |
|---|---|
| Trend Start Date | 2025-06-23 |
| Trend End Date | 2025-11-06 |
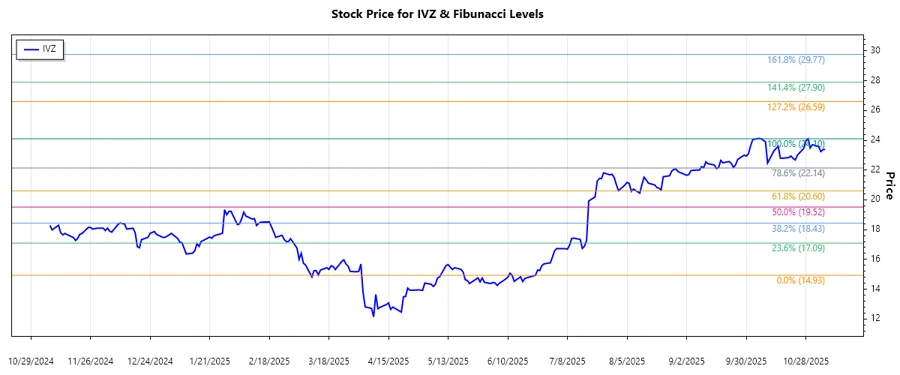
| Highest Price | $24.1 (2025-10-29) |
| Lowest Price | $14.93 (2025-06-23) |
| Fibonacci Level | Price |
|---|---|
| 0.236 | $17.38 |
| 0.382 | $18.92 |
| 0.5 | $19.52 |
| 0.618 | $20.12 |
| 0.786 | $20.91 |
The current price of $23.39 is above the 0.786 level, indicating a possible continuation of the upward trend with potential support around the 0.786 Fibonacci level. This behavior could mean psychological support, making it a key point to watch for traders.
Conclusion
Invesco Ltd.'s recent price movements suggest a stable upward trend, underpinned by strong technical support levels. The resistance observed at the $24.1 range provides a critical point for potential breakout opportunities. However, investors should monitor for any signs of reversal at profit-taking levels around $24. The company's extensive fund options and global investment strategy enhance its resilience, though macroeconomic factors continue to pose risks. Overall, Invesco's strategic diversification aligns well with long-term growth potential, making it an attractive option for portfolio diversification. Ongoing monitoring of market conditions and economic indicators remains essential for optimized investment strategies.
Smart Data Insight
Master the Perfect Entry & Exit for this Stock
Don't leave your profits to chance. Historically, this stock follows specific seasonal patterns that institutional traders use to maximize returns.
- ✅ Identify the "Golden Buying Window"
- ✅ Avoid high-risk correction cycles
- ✅ Backtested data from the last 20+ years