
July 06, 2026 a 12:46 pm

IVZ: Dividend Analysis - Invesco Ltd.
Invesco Ltd. (IVZ) presents a mixed dividend profile, with a moderate yield of 3.12% and a steady history of dividend payments over 32 years. However, its high EPS payout ratio indicates potential sustainability challenges. Investors should consider the balance between current yield and long-term growth potential.
📊 Overview
Invesco Ltd. operates in the financial sector, consistently paying dividends for over three decades, which demonstrates its commitment to returning value to shareholders. The company boasts a dividend yield of 3.12% and a current dividend per share of $1.29, maintaining a stable dividend history over 32 years. There have been no recent cuts or suspensions, highlighting its strong dividend continuity.
| Metric | Value |
|---|---|
| Sector | Financial |
| Dividend yield | 3.12% |
| Current dividend per share | $1.29 USD |
| Dividend history | 32 years |
| Last cut or suspension | None |
🗣️ Dividend History
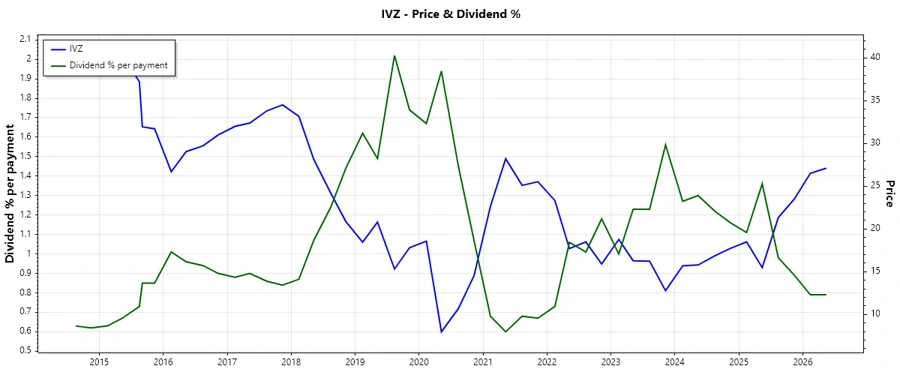
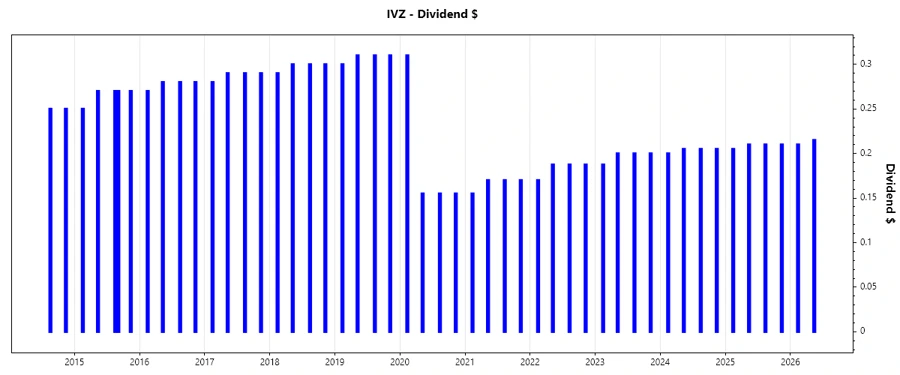
Invesco Ltd. has maintained a robust dividend payout history over the last few years, indicative of its financial solidity. The dividends reflect the company's prioritization of shareholder returns and signal strong operational cash flows. A long uninterrupted dividend history is often seen as a mark of reliability.
| Year | Dividend Per Share (USD) |
|---|---|
| 2026 | 0.425 |
| 2025 | 0.835 |
| 2024 | 0.815 |
| 2023 | 0.7875 |
| 2022 | 0.7325 |
📈 Dividend Growth
The growth of Invesco's dividends over the past few years highlights a focus on consistent shareholder value enhancement. This growth serves as a benchmark for its potential to compound investor returns over time.
| Time | Growth |
|---|---|
| 3 years | 4.46% |
| 5 years | 1.50% |
The average dividend growth is 1.50% over 5 years. This shows moderate but steady dividend growth.
✅ Payout Ratio
The payout ratio paints a critical picture of dividend sustainability. A lower ratio typically indicates that a company retains earnings for reinvestment in growth, which can be more sustainable.
| Key figure ratio | Value |
|---|---|
| EPS-based | -239.02% |
| Free cash flow-based | 31.97% |
The EPS-based payout ratio of -239.02% suggests unsustainable dividend payouts relative to earnings, while the free cash flow payout ratio of 31.97% indicates better coverage and sustainability.
💵 Cashflow & Capital Efficiency
Reviewing cash flow metrics is essential for assessing the operational efficiency and financial health of a company. Cash flow serves as the lifeblood of dividends, capital investment, and debt servicing.
| Year | 2025 | 2024 | 2023 |
|---|---|---|---|
| Free Cash Flow Yield | 12.16% | 14.03% | 14.01% |
| Earnings Yield | -2.38% | 9.70% | -1.19% |
| CAPEX to Operating Cash Flow | 5.53% | 5.81% | 12.63% |
| Stock-based Compensation to Revenue | 1.25% | 1.72% | 2.00% |
| Free Cash Flow / Operating Cash Flow Ratio | 94.47% | 94.19% | 87.37% |
The cash flow stability, with robust free cash flow yield and moderate capex to operating cash flow ratios, suggests effective management of capital investments.
📊 Balance Sheet & Leverage Analysis
A solid balance sheet with manageable levels of debt is crucial for a company to maintain operations during financial stress periods, securing stable future dividends.
| Year | 2025 | 2024 | 2023 |
|---|---|---|---|
| Debt-to-Equity | 0.83 | 0.52 | 0.62 |
| Debt-to-Assets | 0.37 | 0.28 | 0.31 |
| Debt-to-Capital | 0.45 | 0.34 | 0.38 |
| Net Debt to EBITDA | 7.29 | 4.87 | 6.29 |
| Current Ratio | 0.53 | 3.14 | 1.27 |
| Quick Ratio | 43.01 | 3.14 | 1.27 |
| Financial Leverage | 2.22 | 1.86 | 1.98 |
Invesco's financial leverage and solvency ratios imply stable financial health, indicating a comprehensively managed debt structure, allowing for reliable dividend payments.
📈 Fundamental Strength & Profitability
The ability to yield respectable returns on equity and assets reflects the company's fundamental strength, supporting its dividend capacity.
| Year | 2025 | 2024 | 2023 |
|---|---|---|---|
| Return on Equity | -2.30% | 5.32% | -0.66% |
| Return on Assets | -1.04% | 2.87% | -0.33% |
| Margins: Net | -4.42% | 12.77% | -1.70% |
| Margins: EBIT | -8.57% | 17.53% | -2.93% |
| Margins: EBITDA | 21.59% | 20.49% | 19.79% |
| Margins: Gross | 43.18% | 33.41% | 35.08% |
| Research & Development to Revenue | 0% | 0% | 0% |
Although certain returns and margins are lacking, overall profitability illustrates the potential for future upsides with continual focus on operational efficiencies.
📉 Price Development
📝 Dividend Scoring System
| Criteria | Score | |
|---|---|---|
| Dividend yield | 3 | |
| Dividend Stability | 4 | |
| Dividend growth | 2 | |
| Payout ratio | 1 | |
| Financial stability | 3 | |
| Dividend continuity | 4 | |
| Cashflow Coverage | 4 | |
| Balance Sheet Quality | 3 |
Overall Score: 24/40
🏆 Rating
Invesco Ltd. provides a credible dividend yield with established continuity and moderate growth potential. However, concerns over payout sustainability due to negative EPS coverage and challenging financial returns require cautious optimism. Investors should weigh the potential return against inherent risks before making investment decisions.
Smart Data Insight
Master the Perfect Entry & Exit for this Stock
Don't leave your profits to chance. Historically, this stock follows specific seasonal patterns that institutional traders use to maximize returns.
- ✅ Identify the "Golden Buying Window"
- ✅ Avoid high-risk correction cycles
- ✅ Backtested data from the last 20+ years