October 21, 2025 a 03:31 pm

IVZ: Dividend Analysis - Invesco Ltd.
Invesco Ltd. presents a mixed dividend profile with a current yield of 3.89%. Their 31-year dividend history indicates a commitment to shareholders, though recent growth has been modest. Payout ratios are relatively high, reflecting a need for caution alongside the stability offered by established operations.
Overview 📊
Invesco Ltd. operates within the financial sector, known for its consistent yet sometimes volatile dividend patterns. Here is an overview of its current dividend statistics:
| Metric | Value |
|---|---|
| Sector | Financials |
| Dividend yield | 3.89% |
| Current dividend per share | 1.33 USD |
| Dividend history | 31 years |
| Last cut or suspension | None |
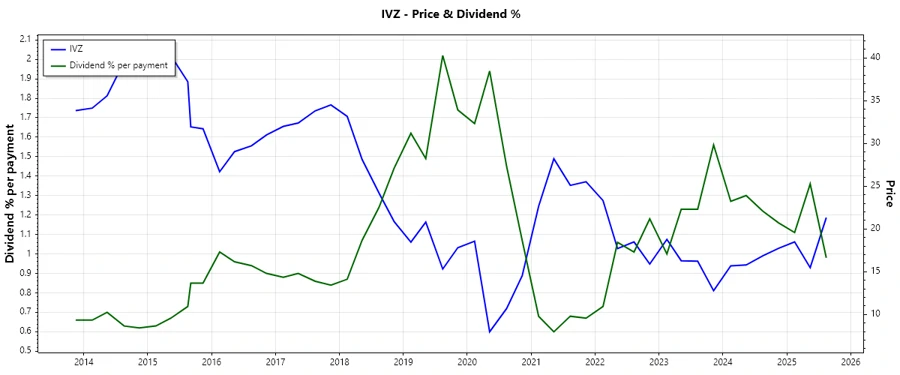
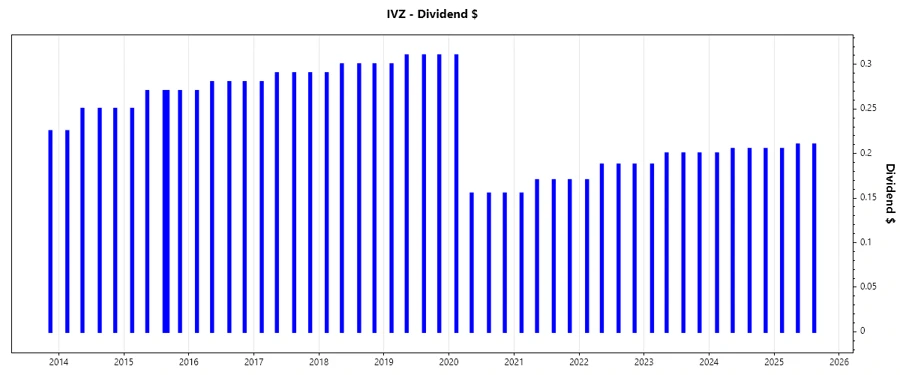
Dividend History 🗣️
The longevity of Invesco's dividend history signals reliability, an essential factor for income-focused investors. This stability underpins investor confidence despite erratic economic conditions.
| Year | Dividend per Share (USD) |
|---|---|
| 2025 | 0.625 |
| 2024 | 0.815 |
| 2023 | 0.7875 |
| 2022 | 0.7325 |
| 2021 | 0.665 |
Dividend Growth 📈
Dividend growth reflects the company’s ability to enhance shareholder returns over time. It is a critical measure of financial health and management’s commitment to reward investors.
| Time | Growth |
|---|---|
| 3 years | 7.02% |
| 5 years | -7.9% |
The average dividend growth is -7.90% over 5 years. This shows moderate but steady dividend growth impeded by recent downturns.
Payout Ratio ✅
Payout ratios offer insight into Invesco's capacity to maintain its dividend payments based on current earnings and cash flow. Healthy ratios suggest a sustainable dividend with room for growth.
| Key figure | Ratio |
|---|---|
| EPS-based | 73.99% |
| Free cash flow-based | 49.58% |
With an EPS payout ratio at 73.99% and a FCF payout ratio at 49.58%, Invesco shows a manageable dividend strategy that supports ongoing payments without overstressing cash flows.
Cashflow & Capital Efficiency 💵
Understanding Invesco’s cash flow and capital efficiency metrics provides crucial context for its dividend sustainability and the financial return on its invested capital.
| Metric | 2024 | 2023 | 2022 |
|---|---|---|---|
| Free Cash Flow Yield | 14.03% | 14.01% | 6.20% |
| Earnings Yield | 9.70% | -1.19% | 11.19% |
| CAPEX to Operating Cash Flow | 5.81% | 12.63% | 27.43% |
| Stock-based Compensation to Revenue | 1.72% | 2.00% | 1.76% |
| Free Cash Flow / Operating Cash Flow Ratio | 94.19% | 87.37% | 72.57% |
The data reveals robust cash flow generation and capital efficiency improvements over the last year, indicating good capital management practices.
Balance Sheet & Leverage Analysis 📉
Balance sheet metrics and leverage ratios are critical for assessing financial health, risk, and the company's ability to service its debt.
| Metric | 2024 | 2023 | 2022 |
|---|---|---|---|
| Debt-to-Equity | 0.52 | 0.62 | 0.56 |
| Debt-to-Assets | 0.28 | 0.31 | 0.29 |
| Debt-to-Capital | 0.34 | 0.38 | 0.36 |
| Net Debt to EBITDA | 4.87 | 6.29 | 4.66 |
| Current Ratio | 0.35 | 0.00 | 1.35 |
| Quick Ratio | 3.14 | 1.27 | 1.35 |
| Financial Leverage | 1.86 | 1.98 | 1.96 |
The financial leverage ratios indicate a controlled debt position, though the trend towards increased leverage warrants vigilance to preserve financial health and minimize exposure to systemic risks.
Fundamental Strength & Profitability 📈
Profitability and operational efficiency metrics are key indicators of operational success and investor return expectations.
| Metric | 2024 | 2023 | 2022 |
|---|---|---|---|
| Return on Equity | 5.32% | -0.66% | 6.05% |
| Return on Assets | 2.87% | -0.33% | 3.09% |
| Margins: Net | 12.77% | -1.70% | 15.22% |
| Margins: EBIT | 17.53% | -2.93% | 22.03% |
| Margins: EBITDA | 20.49% | 19.79% | 25.26% |
| Margins: Gross | 33.41% | 35.08% | 40.30% |
| Research & Development to Revenue | 0% | 0% | 0% |
The fundamental indicators display some volatility but overall signify efficient asset use in revenue generation, crucial for sustaining competitive advantage and enhancing stockholder worth.
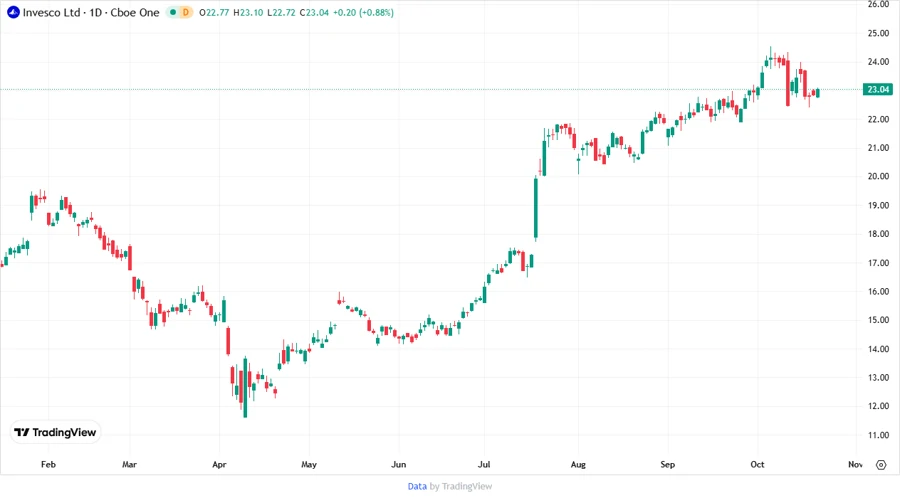
Price Development 📈
Dividend Scoring System 🔍
| Criteria | Score (1-5) | Score Bar |
|---|---|---|
| Dividend yield | 4 | |
| Dividend Stability | 5 | |
| Dividend growth | 2 | |
| Payout ratio | 3 | |
| Financial stability | 3 | |
| Dividend continuity | 4 | |
| Cashflow Coverage | 4 | |
| Balance Sheet Quality | 3 |
Total Score: 28/40
Rating 🏅
Invesco Ltd. demonstrates a strong dedication to its dividend policy with a mixed recent performance. Investor caution is advisable due to the company's high payout ratio, which could impact future dividend growth if earnings dampen. Consideration of its steady historical payments makes Invesco an intriguing option for those seeking reliable income, though growth-orientated investors may find its future prospects somewhat limited.
Smart Data Insight
Master the Perfect Entry & Exit for this Stock
Don't leave your profits to chance. Historically, this stock follows specific seasonal patterns that institutional traders use to maximize returns.
- ✅ Identify the "Golden Buying Window"
- ✅ Avoid high-risk correction cycles
- ✅ Backtested data from the last 20+ years