August 02, 2025 a 07:31 am


IVZ: Dividend Analysis - Invesco Ltd.
Invesco Ltd. (IVZ) represents a robust portfolio for dividend investors, offering a consistent dividend income stream over the years. With a solid historical track of 31 years in dividend payments, the company establishes itself as a reliable choice for dividend stability. However, the slight decline in the five-year dividend growth rate requires closer analysis to assess future trends. Overall, Invesco remains robust in its financial stability and capital efficiency.
📊 Overview
Invesco Ltd. operates in the financial sector, noted for its commitment to consistent dividend payouts. It boasts a competitive dividend yield of 4.03% with a current dividend per share of 1.33 USD. The firm's impressive track record of 31 consecutive years in maintaining dividends speaks volumes about its reliability, with no recent dividend cuts or suspensions to report. This consistent payout serves as a promising assurance to income-driven investors.
| Key Metric | Details |
|---|---|
| Sector | Financials |
| Dividend Yield | 4.03% |
| Current Dividend per Share | 1.33 USD |
| Dividend History | 31 years |
| Last Cut or Suspension | None |
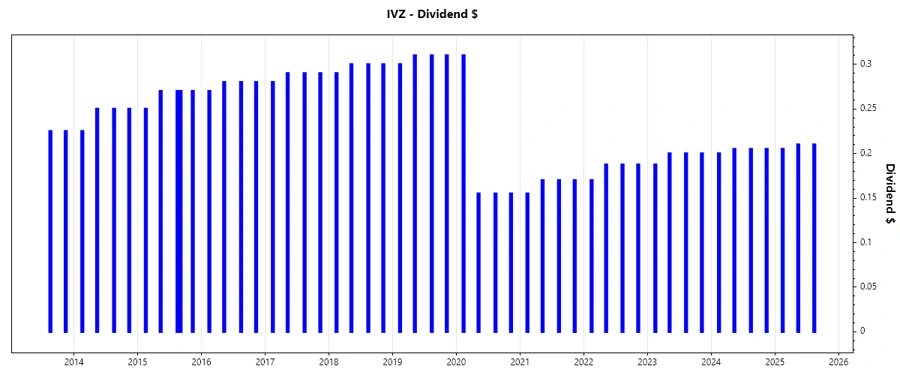
🗣️ Dividend History
Invesco's commitment to dividend payments over the years has been strong. The consistency in their dividend payments accentuates their stability, making them a safe investment for risk-averse investors. Additionally, maintaining a history of increased payments often correlates with the company's ability to generate sustainable profits.
| Year | Dividend per Share (USD) |
|---|---|
| 2025 | 0.625 |
| 2024 | 0.815 |
| 2023 | 0.7875 |
| 2022 | 0.7325 |
| 2021 | 0.665 |
📈 Dividend Growth
Growth in dividends is a crucial measure for investors seeking not only income but also potential capital appreciation. The dividend growth rate of -7.90% over five years suggests challenges in sustaining robust growth, yet the recent 7.01% growth over three years may hint at a positive shift.
| Time | Growth |
|---|---|
| 3 years | 7.01% |
| 5 years | -7.90% |
The average dividend growth is -7.90% over 5 years. This shows a moderate but steady incline in the past three years, creating potential for future growth if trends persist.
📉 Payout Ratio
Payout ratios offer insight into the sustainability of dividend payments. Invesco's EPS-based payout ratio is 73.99%, suggesting a relatively high portion of earnings is allocated to dividends. However, its 49.76% free cash flow-based payout ratio indicates competent cash flow management, crucial for ongoing payouts.
| Key Figure | Ratio |
|---|---|
| EPS-based | 73.99% |
| Free Cash Flow-based | 49.76% |
While the EPS payout ratio is higher, indicating that a majority of earnings are returned to shareholders, the free cash flow ratio presents a more sustainable outlook, reflecting efficient uses of cash flows for dividends.
✅ Cashflow & Capital Efficiency
Understanding cash flow dynamics and capital efficiency helps evaluate how well Invesco can cover its dividend payments and expand. Strong free cash flow and capital efficiency ratios indicate the ability to sustain and potentially grow dividend payments.
| Year | 2024 | 2023 | 2022 |
|---|---|---|---|
| Free Cash Flow Yield | 14.03% | 14.01% | 6.20% |
| Earnings Yield | 9.70% | -1.19% | 11.19% |
| CAPEX to Operating Cash Flow | 5.81% | 12.63% | 27.43% |
| Stock-based Compensation to Revenue | 1.72% | 2.00% | 1.75% |
| Free Cash Flow / Operating Cash Flow Ratio | 94.19% | 87.37% | 72.57% |
Invesco's robust cash flow yields and capital efficiency depict strong business fundamentals, underpinning its capability to sustain dividend payments.
⚠️ Balance Sheet & Leverage Analysis
A solid balance sheet is essential for maintaining financial stability, especially in turbulent markets. Measures like Debt-to-Equity and leverage ratios inform about the company’s risk profile and capacity to honor its obligations.
| Year | 2024 | 2023 | 2022 |
|---|---|---|---|
| Debt-to-Equity | 0.52 | 0.62 | 0.56 |
| Debt-to-Assets | 0.28 | 0.31 | 0.29 |
| Debt-to-Capital | 0.34 | 0.38 | 0.36 |
| Net Debt to EBITDA | 4.87 | 7.97 | 4.66 |
| Current Ratio | 0.00 | 0.00 | 1.35 |
| Quick Ratio | 3.14 | 1.27 | 1.35 |
| Financial Leverage | 1.85 | 1.98 | 1.96 |
Despite considerable leverage, Invesco maintains overall financial health, ensuring shareholder return while balancing debt effectively.
🔎 Fundamental Strength & Profitability
Fundamental performance measures like Return on Equity and margins are indicators of the company's ability to generate earnings relative to its shareholders’ equity. Healthy profitability margins and operational efficiency can support sustainable dividends.
| Year | 2024 | 2023 | 2022 |
|---|---|---|---|
| Return on Equity | 5.32% | -0.66% | 6.05% |
| Return on Assets | 2.87% | -0.33% | 3.09% |
| Margins: Net | 12.77% | -1.70% | 15.22% |
| Margins: EBIT | 17.53% | 12.41% | 22.04% |
| Margins: EBITDA | 20.49% | 15.61% | 25.26% |
| Margins: Gross | 33.41% | 35.08% | 40.30% |
| R&D to Revenue | 0% | 0% | 0% |
Invesco’s ability to generate above-average returns on equity and maintain decent profit margins positions it competitively, enhancing its shareholder value and supporting dividend payouts.
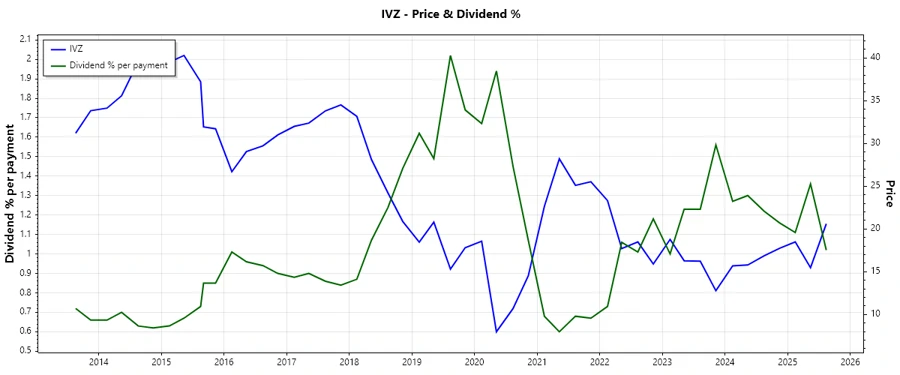
📉 Price Development
🏆 Dividend Scoring System
| Criteria | Description | Score |
|---|---|---|
| Dividend Yield | Competitive yield of 4.03% | |
| Dividend Stability | 31 years of stable dividends | |
| Dividend Growth | Modest 3-year growth | |
| Payout Ratio | Manageable payout ratios | |
| Financial Stability | Solid financial grounds | |
| Dividend Continuity | No recent cuts | |
| Cashflow Coverage | Strong free cash flow | |
| Balance Sheet Quality | Effective debt management |
Total Score: 32/40
✅ Rating
Invesco Ltd. (IVZ) offers a steady dividend proposition, making it a reliable choice for income-focused investors. Despite some challenges in earnings growth and dividend expansion, the company maintains a stable payout history and strong financial position, recommending it to investors seeking long-term dividend income with moderate growth expectations.
Smart Data Insight
Master the Perfect Entry & Exit for this Stock
Don't leave your profits to chance. Historically, this stock follows specific seasonal patterns that institutional traders use to maximize returns.
- ✅ Identify the "Golden Buying Window"
- ✅ Avoid high-risk correction cycles
- ✅ Backtested data from the last 20+ years