July 03, 2025 a 07:31 am


IVZ: Dividend Analysis - Invesco Ltd.
Invesco Ltd. offers an intriguing dividend profile with a robust history of consistent payments and a notable yield. Despite some recent challenges in growth, the company demonstrates resilience through stable payout ratios, making it a potentially attractive option for income-focused investors. Analyzing key financial metrics suggests a mixed but promising outlook for dividend sustainability.
Overview 📊
Invesco Ltd. operates in the financial sector, characterized by a steady dividend history of 31 years without recent cuts. The current dividend yield stands at 5.33%, alongside a dividend per share of 1.33 USD. This showcases the company's consistency in shareholder returns, though recent growth figures merit further investigation.
| Metric | Value |
|---|---|
| Sector | Financial |
| Dividend Yield | 5.33% |
| Current Dividend Per Share | 1.33 USD |
| Dividend History | 31 years |
| Last Cut or Suspension | None |
Dividend History 🗣️
The long-standing dividend history of Invesco Ltd. underlines its resilience in providing sustained shareholder value. This track record is fundamental for potential investors assessing stability and future income potential.
| Year | Dividend Per Share (USD) |
|---|---|
| 2025 | 0.415 |
| 2024 | 0.815 |
| 2023 | 0.7875 |
| 2022 | 0.7325 |
| 2021 | 0.665 |
Dividend Growth 📈
Examining the dividend growth of Invesco Ltd., we note a recent 3-year growth of 7.02%. However, over a 5-year period, there is a marked negative growth of 7.90%. These figures indicate a decline over the longer term, necessitating careful consideration for growth-oriented investors.
| Time | Growth |
|---|---|
| 3 years | 7.02% |
| 5 years | -7.90% |
The average dividend growth is -7.90% over 5 years. This shows moderate but steady dividend growth challenges.
Payout Ratio ✅
The payout ratio serves as a critical indicator of dividend sustainability. Currently, Invesco Ltd. maintains an EPS payout ratio of 74.94% and an FCF payout ratio of 54.74%. These ratios suggest a balanced and manageable approach to dividend commitments relative to earnings and cash flows.
| Key Figure | Ratio |
|---|---|
| EPS-based | 74.94% |
| Free cash flow-based | 54.74% |
The EPS payout ratio of 74.94% indicates a cautious but feasible level of dividend distribution, while the FCF ratio provides an even more comfortable buffer, both key in assessing dividend sustainability.
Cashflow & Capital Efficiency ⚠️
Free cash flow yield and capital efficiency are essential for assessing the company's ability to finance its operations and growth. Invesco Ltd. exhibits a free cash flow yield of 14.56% with a CAPEX to operating cash flow ratio of 6.16%, suggesting robust cash generation relative to its capital investments.
| Metric | 2024 | 2023 | 2022 |
|---|---|---|---|
| Free Cash Flow Yield | 14.03% | 14.01% | 6.20% |
| Earnings Yield | 9.70% | -1.19% | 11.19% |
| CAPEX to Operating Cash Flow | 5.81% | 12.63% | 27.43% |
| Stock-based Compensation to Revenue | 1.72% | 2.00% | 1.76% |
| Free Cash Flow / Operating Cash Flow Ratio | 94.19% | 87.37% | 72.57% |
The company's cash flow metrics reflect stable operating performance with efficient capital use, indicative of its strong cash flow generation capabilities crucial for ongoing dividend support.
Balance Sheet & Leverage Analysis 📉
Leverage ratios are insight into the financial risk and capital structure of Invesco Ltd. The debt-to-equity ratio sits at 0.52, conveying a balance between debt and equity financing. These figures suggest a prudent level of leverage that should mitigate financial risk.
| Metric | 2024 | 2023 | 2022 |
|---|---|---|---|
| Debt-to-Equity | 0.52 | 0.62 | 0.56 |
| Debt-to-Assets | 0.28 | 0.31 | 0.29 |
| Debt-to-Capital | 0.34 | 0.38 | 0.36 |
| Net Debt to EBITDA | 4.87 | 6.98 | 4.66 |
| Current Ratio | 3.14 | 0.95 | 1.62 |
| Quick Ratio | 3.14 | 0.95 | 1.62 |
| Financial Leverage | 1.86 | 1.98 | 1.96 |
Invesco Ltd.'s balance sheet depicts a stable structure with moderate leverage, reflecting sound risk management strategies and providing a solid foundation for future financial commitments, including dividends.
Fundamental Strength & Profitability 📊
Profitability ratios are vital for understanding Invesco Ltd.'s operational performance and efficiency. With a return on equity of 5.49% and healthy margins, the company displays competitive performance, key for sustaining long-term profitability.
| Metric | 2024 | 2023 | 2022 |
|---|---|---|---|
| Return on Equity | 5.32% | -0.66% | 6.05% |
| Return on Assets | 2.87% | -0.33% | 3.09% |
| Margins: Net | 12.77% | -1.70% | 15.22% |
| Margins: EBIT | 17.53% | 12.41% | 22.04% |
| Margins: EBITDA | 20.49% | 17.82% | 25.26% |
| Margins: Gross | 33.41% | 35.08% | 40.30% |
| Research & Development to Revenue | 0% | 0% | 0% |
Invesco Ltd. demonstrates solid profitability and efficient operations, with noteworthy margins that underpin its capacity to generate shareholder returns and support dividend policies.
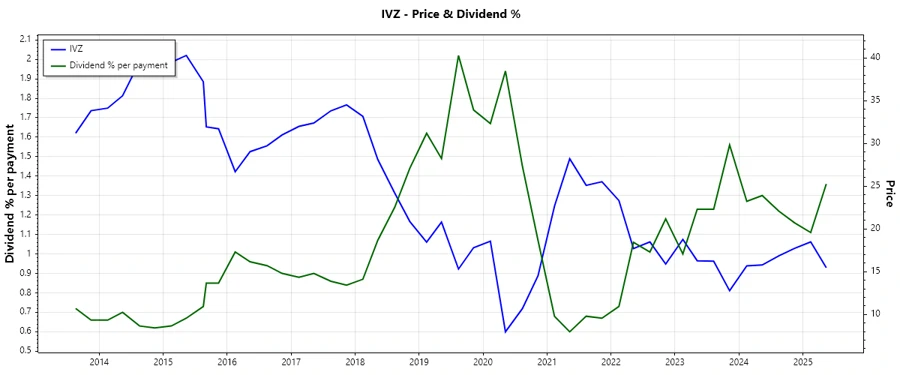
Price Development 📈
Dividend Scoring System 🗳️
| Criteria | Score | |
|---|---|---|
| Dividend yield | 4 | |
| Dividend Stability | 5 | |
| Dividend growth | 2 | |
| Payout ratio | 3 | |
| Financial stability | 4 | |
| Dividend continuity | 5 | |
| Cashflow Coverage | 4 | |
| Balance Sheet Quality | 4 |
Overall Score: 31/40
Rating ✅
In conclusion, Invesco Ltd. presents a strong dividend profile with an appealing yield and a steadfast history of payments. While dividend growth has faced challenges, the overall financial health and cash flow stability support its dividend sustainability. Investors seeking reliable income may find Invesco Ltd. to be a commendable option in their portfolio.
Smart Data Insight
Master the Perfect Entry & Exit for this Stock
Don't leave your profits to chance. Historically, this stock follows specific seasonal patterns that institutional traders use to maximize returns.
- ✅ Identify the "Golden Buying Window"
- ✅ Avoid high-risk correction cycles
- ✅ Backtested data from the last 20+ years