
June 24, 2026 a 09:03 am
IT: Trend and Support & Resistance Analysis - Gartner, Inc.
Gartner, Inc., a leader in research and advisory services, shows a volatile movement with notable fluctuations in its stock price. By leveraging its diverse business model, including Research, Conferences, and Consulting segments, it has maintained a solid presence in the market. Current data analysis indicates potential shifts in investor sentiment, possibly attributed to macroeconomic factors and internal growth strategies. Investors should closely monitor the company's financial results and strategic initiatives for making informed decisions.
Trend Analysis
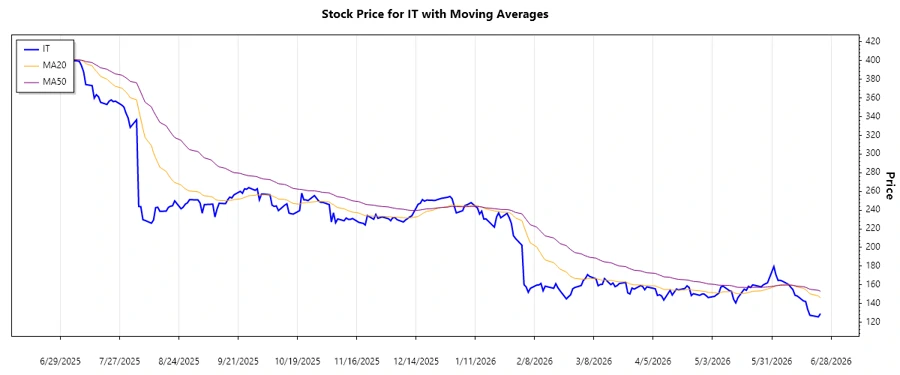
The price analysis for Gartner, Inc. reveals fluctuating trends over the observed period. Calculating the Exponential Moving Averages (EMAs), we can discern distinct patterns:
| Date | Close Price | Trend |
|---|---|---|
| 2026-06-23 | $129.18 | ▼ Down |
| 2026-06-22 | $125.73 | ▼ Down |
| 2026-06-18 | $127.49 | ▼ Down |
| 2026-06-17 | $133.58 | ▲ Up |
| 2026-06-16 | $142.24 | ▲ Up |
| 2026-06-15 | $142.77 | ▲ Up |
| 2026-06-12 | $148.17 | ▲ Up |
The current EMA analysis indicates a short-term downward trend with some recovery attempts. This suggests a prevailing bearish sentiment, but potential for reversal exists.
Support and Resistance
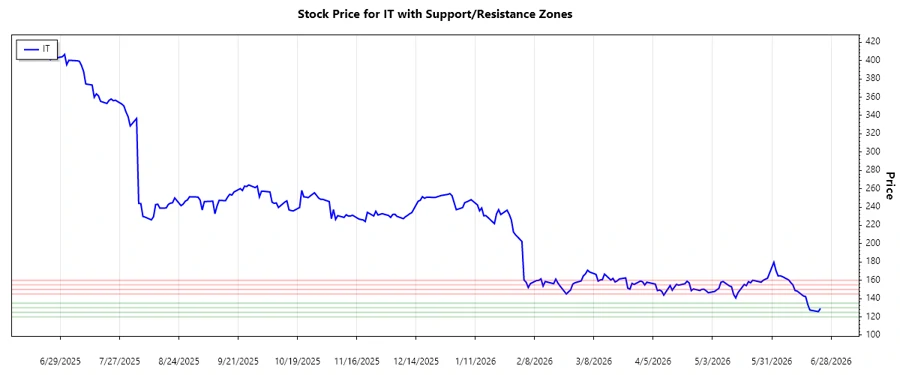
Analyzing the support and resistance levels, the following zones are identified:
| Zone | Level |
|---|---|
| Support Zone 1 | ↓ $120.00 - $125.00 |
| Support Zone 2 | ↓ $130.00 - $135.00 |
| Resistance Zone 1 | ↑ $145.00 - $150.00 |
| Resistance Zone 2 | ↑ $155.00 - $160.00 |
The current stock price is nearing the lower support zone, which could indicate an opportune buying signal if stabilization occurs. Observing the breakout from these zones will provide further technical indications.
Conclusion
Gartner, Inc.'s stock is currently showing a potential downward trend based on EMA analysis. However, the proximity of the lower support zone suggests a possible stabilization. Investors should remain cautious and review other external factors affecting the company's business. The presence of distinct support and resistance levels offers strategic entries and exits for traders.
Smart Data Insight
Master the Perfect Entry & Exit for this Stock
Don't leave your profits to chance. Historically, this stock follows specific seasonal patterns that institutional traders use to maximize returns.
- ✅ Identify the "Golden Buying Window"
- ✅ Avoid high-risk correction cycles
- ✅ Backtested data from the last 20+ years