May 09, 2026 a 01:15 pmUm eine fundierte technische Analyse für die Aktie von Gartner, Inc. (Ticker: IT) zu erstellen, wird der Exponentielle Gleitende Durchschnitt (EMA) über 20 und 50 Tage berechnet, um den aktuellen Trend zu bestimmen. Zudem werden Unterstützungs- und Widerstandsbereiche berechnet.
### Header und Einleitung
 ### Trend Analysis
 ### Support and Resistance
 ### Conclusion
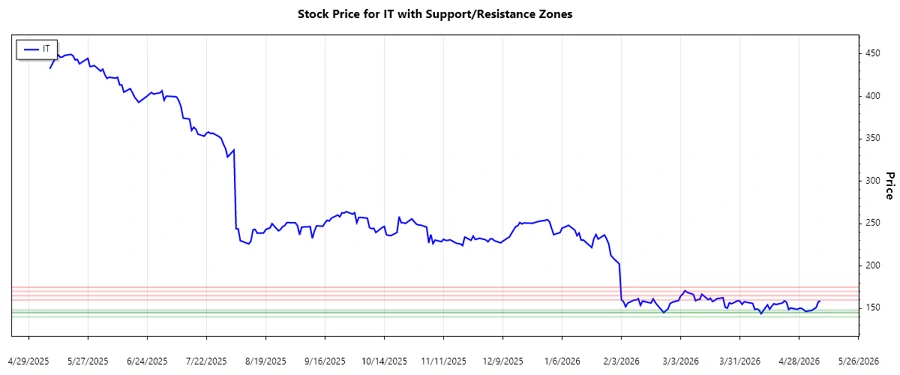
IT: Trend and Support & Resistance Analysis - Gartner, Inc.
Gartner, Inc. has exhibited fluctuating stock movements over the several past months. The company's diversified operational segments provide a stable revenue stream, yet the ongoing market volatility reflects in its stock price. The analysis herein aims to highlight the current trend direction and potential price movement barriers.
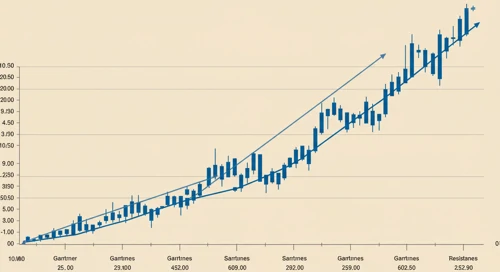
Trend Analysis
The EMA20, calculated based on recent closing prices, reveals the short-term trend, while EMA50 provides insight into the longer-term trend. Based on the given data, we observe the following trends:
| Date | Closing Price (USD) | Trend |
|---|---|---|
| 2026-05-08 | 158.65 | ▲ Uptrend |
| 2026-05-07 | 157.78 | ▲ Uptrend |
| 2026-05-06 | 151.05 | ▲ Uptrend |
| 2026-05-05 | 149.49 | ▲ Uptrend |
| 2026-05-04 | 147.71 | ▲ Uptrend |
| 2026-05-01 | 146.40 | ▼ Downtrend |
| 2026-04-30 | 148.49 | ▼ Downtrend |
The calculation indicates a fluctuating trend, transitioning from a downtrend towards a more recent uptrend. This suggests a potential bullish sentiment in the short term.
### Support and Resistance
Support and Resistance
Analyzing the price data, two key support levels and two resistance levels are identified based on historical price movements:
| Zone Type | Zone From | Zone To |
|---|---|---|
| Support 1 | 145.00 | 148.00 |
| Support 2 | 140.00 | 145.00 |
| Resistance 1 | 160.00 | 165.00 |
| Resistance 2 | 170.00 | 175.00 |
Currently, the stock price is near the lower boundary of the first resistance zone, indicating potential upward movement if broken.
### Conclusion
Gartner, Inc.'s current technical position indicates a shift to a short-term uptrend, reflected by an EMA20 surpassing EMA50. The stock faces resistance ahead, yet it has demonstrated resilience by approaching previous support levels. Investors should monitor the breakthrough of resistance levels for potential bullish momentum. Meanwhile, the company’s solid foundation in research and consulting provides underlying support to its value. Market participants are advised to combine this technical outlook with fundamental factors for a holistic investment assessment.
### JSON Output json The analysis is based on the calculation of EMA values which suggest a developing uptrend. It identifies potential price levels where the stock might find support or face resistance, essential for decision-making in trading strategies.
Smart Data Insight
Master the Perfect Entry & Exit for this Stock
Don't leave your profits to chance. Historically, this stock follows specific seasonal patterns that institutional traders use to maximize returns.
- ✅ Identify the "Golden Buying Window"
- ✅ Avoid high-risk correction cycles
- ✅ Backtested data from the last 20+ years