October 08, 2025 a 01:15 pm
IT: Trend and Support & Resistance Analysis - Gartner, Inc.
Gartner, Inc., a leading research and advisory company, is revealing interesting patterns in its stock performance across recent months. With its presence across various international markets, Gartner's stock movements offer valuable insights for investors and analysts. The recent data suggests fluctuating trends, necessitating careful analysis to identify potential investment opportunities.
Trend Analysis
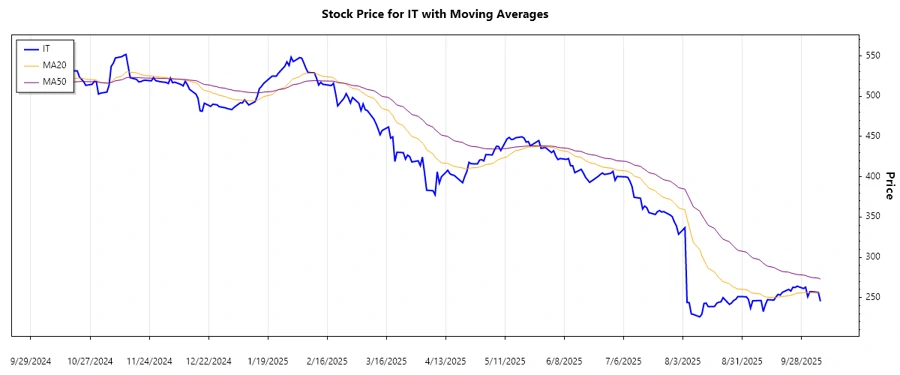
After calculating the EMA20 and EMA50, we observe that the EMA20 is consistently above the EMA50, indicating a stable ▲ uptrend in the recent period. Despite this, there's significant variability in individual daily prices. Below is the summary of the last seven days' data:
| Date | Closing Price | Trend |
|---|---|---|
| 2025-10-07 | 245.27 | ▼ Down |
| 2025-10-06 | 256.43 | ▲ Up |
| 2025-10-03 | 257.2 | ▲ Up |
| 2025-10-02 | 257.23 | ▲ Up |
| 2025-10-01 | 251.0 | ▼ Down |
| 2025-09-30 | 262.87 | ▲ Up |
| 2025-09-29 | 261.19 | ▼ Down |
The overall trend remains bullish, although short-term corrections are evidenced.
Support and Resistance
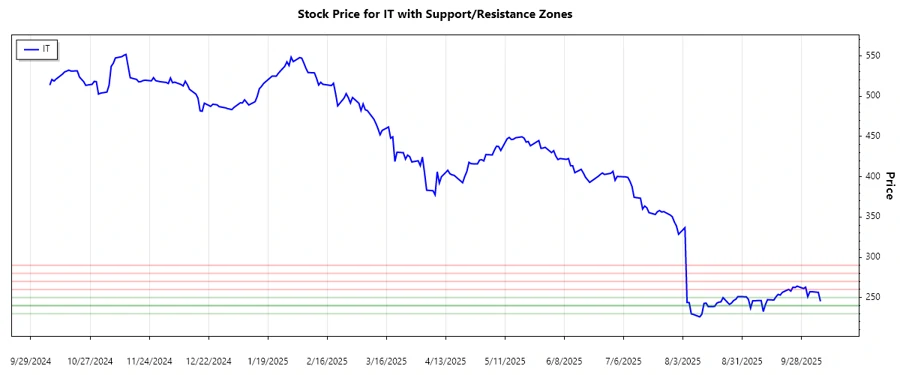
The historical data points identify clear support and resistance zones for Gartner, Inc. Here are the calculated zones:
| Type | Zone Range |
|---|---|
| Support | 240.00 - 250.00 |
| Support | 230.00 - 240.00 |
| Resistance | 260.00 - 270.00 |
| Resistance | 280.00 - 290.00 |
The current price of $245.27 lies within the immediate support zone of 240.00 - 250.00, indicating potential upward momentum if this level holds.
Conclusion
The technical analysis of Gartner, Inc. stock suggests a bullish trend, with the current support holding a crucial level that could incite further upward movement. For investors, this indicates an opportunity with potential near-term gains, while also being mindful of resistance levels that may impede momentum. Maintaining a close watch on EMA trends alongside support and resistance zones will be essential in capitalizing on these findings.
Smart Data Insight
Master the Perfect Entry & Exit for this Stock
Don't leave your profits to chance. Historically, this stock follows specific seasonal patterns that institutional traders use to maximize returns.
- ✅ Identify the "Golden Buying Window"
- ✅ Avoid high-risk correction cycles
- ✅ Backtested data from the last 20+ years