October 06, 2025 a 10:15 am
IT: Fibonacci Analysis - Gartner, Inc.
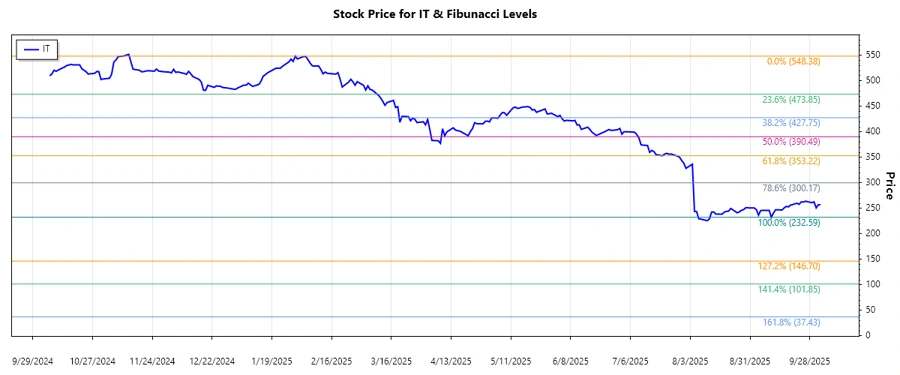
Gartner, Inc. has recently shown significant price movements, with a substantial downtrend over the past months. Their share price dipped from a high of $548.38 on January 30, 2025, to a low of $232.59 on September 10, 2025. With strong international presence in research and advisory services, Gartner's financial performance may adjust as market conditions stabilize. Given their business segments, the company is well-positioned to capitalize on shifts in the IT transformation landscape, though it remains susceptible to macroeconomic adversities.
Fibonacci Analysis
| Data Point | Value |
|---|---|
| Trend Start Date | 2025-01-30 |
| Trend End Date | 2025-09-10 |
| High Price | $548.38 (2025-01-30) |
| Low Price | $232.59 (2025-09-10) |
| Fibonacci Level | Price |
|---|---|
| 0.236 | $335.65 |
| 0.382 | $391.85 |
| 0.5 | $440.49 |
| 0.618 | $489.14 |
| 0.786 | $533.83 |
The current trading price of Gartner is at $257.2, indicating the stock is within the 0.236 retracement zone. This suggests a potential support level, providing an area where the price might stabilize before any further movement.
Conclusion
Gartner, Inc.'s downward price trend suggests caution, especially as the stock has recently entered a Fibonacci retracement zone. If the share price manages to hold itself above the 0.236 level, there could be opportunities for price stabilization or a potential reversal. However, investors should remain vigilant regarding market volatility and potential external factors affecting the IT advisory sector. The company's solid foundation still provides an optimistic long-term outlook if they successfully navigate current financial obstacles. Investors should assess their risk tolerance and consider diversified exposure to mitigate uncertainties.