July 12, 2025 a 10:15 am
IT: Fibonacci Analysis - Gartner, Inc.
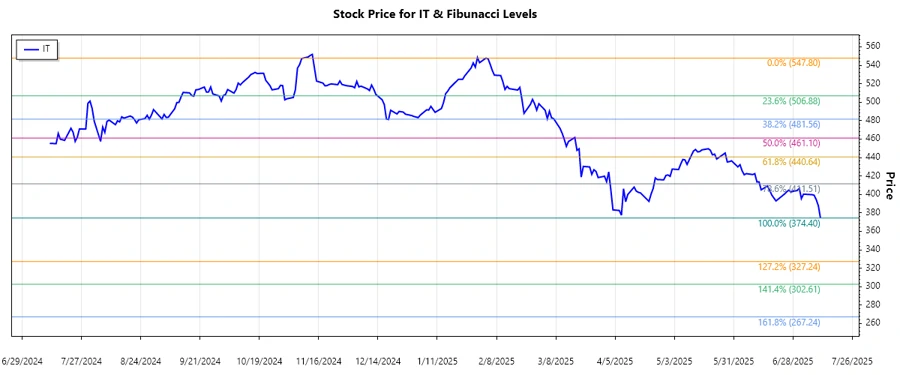
Gartner, Inc. has recently experienced significant market movements. As a leading research and advisory company operating worldwide, it has faced an observable downward trend. This analysis focuses on the recent price trends and key support levels using Fibonacci Retracement. Investors should take note of the technical indicators for identifying potential entry and exit points.
Fibonacci Analysis
Based on the historical data, Gartner, Inc. has experienced a noticeable downward trend. The analysis is focused on pinpointing potential support levels that are crucial for investors.
| Details | Data |
|---|---|
| Start Date of Trend | 2025-02-10 |
| End Date of Trend | 2025-07-11 |
| Highest Price | $547.80 on 2025-02-03 |
| Lowest Price | $374.40 on 2025-07-11 |
| Fibonacci 23.6% | $412.72 |
| Fibonacci 38.2% | $437.78 |
| Fibonacci 50% | $461.10 |
| Fibonacci 61.8% | $484.42 |
| Fibonacci 78.6% | $515.06 |
| Current Price Level | Currently around $374.40, below Fibonacci retracement levels indicating further downward pressure. |
| Technical Interpretation | The price is below the 23.6% retracement, suggesting strong bearish momentum, potentially offering resistances above the current level. |
Conclusion
Gartner, Inc.'s stock has been in a downward trend, which poses both challenges and opportunities for investors. The significant drop from recent highs emphasizes critical areas where investors must be vigilant, especially near Fibonacci retracement levels. Despite the current bearish outlook, these levels can act as potential reversal or continuation points. Analysts should watch for any technical indicators that could signal a change in momentum, especially in global markets impacting Gartner's business segments.
Smart Data Insight
Master the Perfect Entry & Exit for this Stock
Don't leave your profits to chance. Historically, this stock follows specific seasonal patterns that institutional traders use to maximize returns.
- ✅ Identify the "Golden Buying Window"
- ✅ Avoid high-risk correction cycles
- ✅ Backtested data from the last 20+ years