
July 23, 2026 a 07:43 am
ITW: Fundamental Ratio Analysis - Illinois Tool Works Inc.
Illinois Tool Works Inc. (ITW) has established itself as a formidable player in the industrial machinery sector with its diverse array of specialized equipment and industrial goods. Despite a stable market presence, the company's stock performance suggests challenges, mirroring industry complexities and economic fluctuations.
Fundamental Rating
The fundamental rating provides a solid understanding of ITW’s financial health and market position, highlighting strengths and vulnerabilities.
| Category | Score | Visualization |
|---|---|---|
| Overall | 3 | |
| Discounted Cash Flow | 3 | |
| Return on Equity | 5 | |
| Return on Assets | 5 | |
| Debt to Equity | 1 | |
| Price to Earnings | 2 | |
| Price to Book | 1 |
Historical Rating
Comparing historical data provides insights into ITW's performance trajectory over recent periods.
| Date | Overall | DCF | ROE | ROA | D/E | P/E | P/B |
|---|---|---|---|---|---|---|---|
| 2026-07-22 | 3 | 3 | 5 | 5 | 1 | 2 | 1 |
| Previous | 0 | 3 | 5 | 5 | 1 | 2 | 1 |
Analyst Price Targets
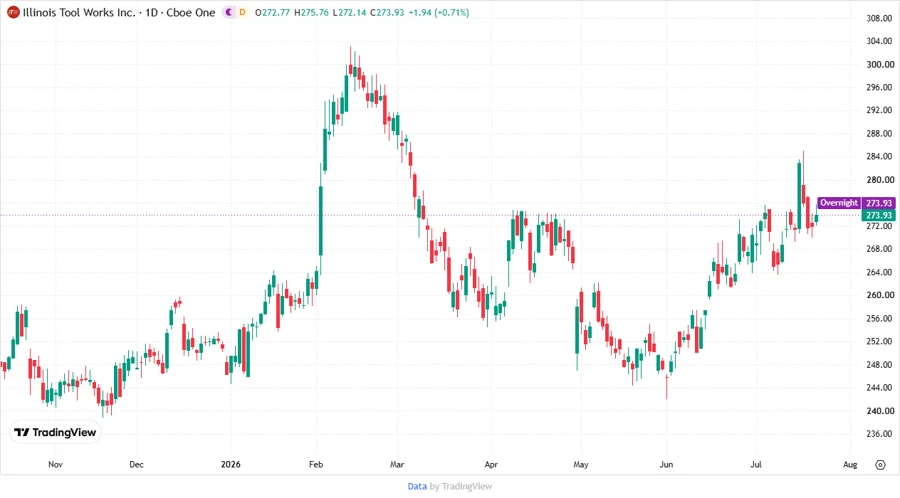
Analyst price targets reflect wide-ranging expectations, often indicative of market volatility concerning ITW stock.
| High | Low | Median | Consensus |
|---|---|---|---|
| $301 | $254 | $276.5 | $275.75 |
Analyst Sentiment
Analyst sentiments reveal a cautious stance on ITW, with a significant emphasis on holding over aggressive buy initiatives.
| Recommendation | Count | Percentage |
|---|---|---|
| Strong Buy | 0 | |
| Buy | 6 | |
| Hold | 13 | |
| Sell | 9 | |
| Strong Sell | 0 |
Conclusion
Illinois Tool Works Inc. presents a stable yet cautious investment opportunity. Current ratings and analyst sentiment suggest potential for steady returns with an emphasis on maintaining existing positions. Despite some areas of overvaluation, the overall financial health remains robust. However, challenges in market dynamics and economic fluctuations pose risks that investors should carefully consider. Prospective investors may need to balance between current industrial demands and intrinsic value concerns.
Smart Data Insight
Master the Perfect Entry & Exit for this Stock
Don't leave your profits to chance. Historically, this stock follows specific seasonal patterns that institutional traders use to maximize returns.
- ✅ Identify the "Golden Buying Window"
- ✅ Avoid high-risk correction cycles
- ✅ Backtested data from the last 20+ years