August 11, 2025 a 05:15 am
ITW: Fibonacci Analysis - Illinois Tool Works Inc.
The stock of Illinois Tool Works Inc. (ITW) has shown significant performance over the past few months. Trading in a versatile industrial products sector, it has showcased resilience and sought-after market adaptability. Offering diverse industrial solutions, ITW remains a pivotal player with potential for future growth, able to leverage both domestic and international market developments.
Fibonacci Analysis
| Metric | Detail |
|---|---|
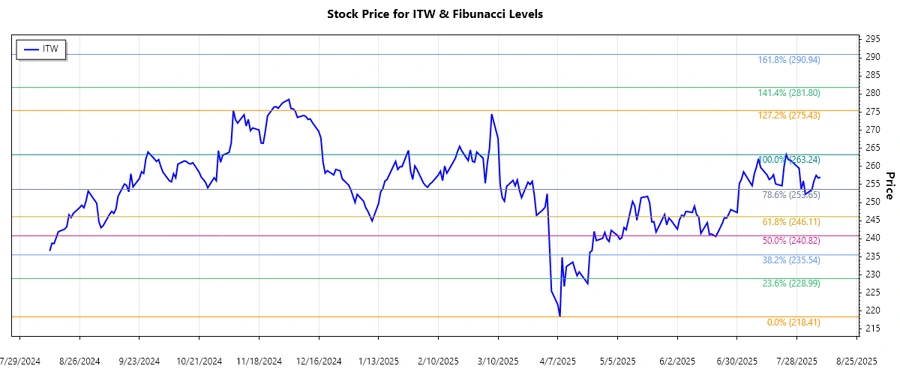
| Trend Duration | April 8, 2025 - August 8, 2025 |
| High Point | $263.24 on July 23, 2025 |
| Low Point | $218.41 on April 8, 2025 |
| Fibonacci Levels |
|
| Current Price Position | The current price is within the 0.236 retracement zone. |
| Technical Interpretation | The current support might hold at 0.236 level, but breaking below could indicate further downside risks. |
Conclusion
Illinois Tool Works Inc. showcases a promising uptrend, with the stock currently retracing at the 0.236 Fibonacci level, indicating potential support. However, investors should monitor for signs of bearish momentum which may signal a break below this support. The diverse industrial segments offer multiple growth pathways, but global economic fluctuations and industry-specific challenges pose risks. For analysts, the developing technical landscape suggests cautious optimism, with emphasis on dynamic positioning should market conditions shift.
Smart Data Insight
Master the Perfect Entry & Exit for this Stock
Don't leave your profits to chance. Historically, this stock follows specific seasonal patterns that institutional traders use to maximize returns.
- ✅ Identify the "Golden Buying Window"
- ✅ Avoid high-risk correction cycles
- ✅ Backtested data from the last 20+ years