May 30, 2025 a 06:44 am

ITW: Fibonacci Analysis - Illinois Tool Works Inc.
Illinois Tool Works Inc. (ITW) shows notable price action in response to market dynamics. The company's broad market presence, with diverse segments, reinforces its position in the industrial sector. Recent price movements indicate a significant trend that investors should consider when planning their strategies.
Fibonacci Analysis
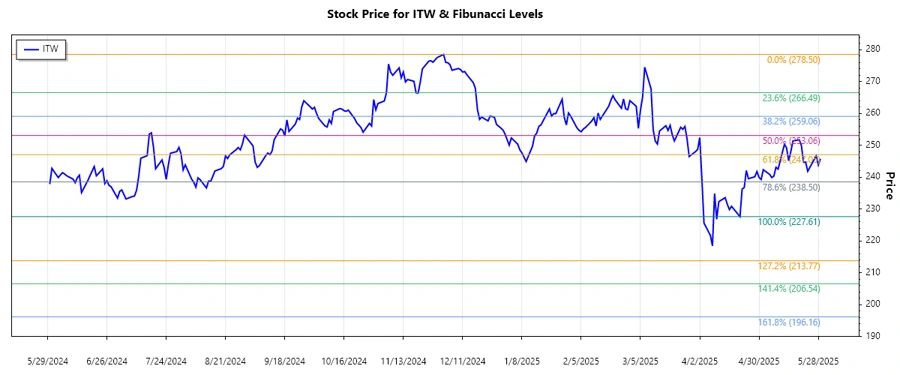
The recent price data for ITW reveals a dominant downtrend, initiating on 2024-12-02 from a high of $278.50 and reaching a low of $227.61 on 2025-04-21. Based on this trend, the following Fibonacci retracement levels have been calculated:
| Level | Price |
|---|---|
| 0.236 | $240.04 |
| 0.382 | $247.09 |
| 0.5 | $253.05 |
| 0.618 | $258.98 |
| 0.786 | $266.98 |
As of the latest price point of $245.73 on 2025-05-29, the stock currently trades below the 0.382 retracement level, suggesting a potential consolidation phase. This could indicate a significant resistance level at $247.09.
Conclusion
The Fibonacci analysis of ITW indicates potential resistance at current levels, reflecting the broader market's cautious sentiment towards industrial stocks. While the trend has shifted downward, offering a potential buy-zone for value investors, it also underscores prevailing market uncertainties. Analysts must remain vigilant, monitoring key support and resistance levels closely. The diversity of Illinois Tool Works Inc.'s operations positions it well for a rebound, yet macroeconomic factors continue to create headwinds. Investors should weigh potential risks and rewards, particularly in light of potential industry shifts and broader economic developments.
Smart Data Insight
Master the Perfect Entry & Exit for this Stock
Don't leave your profits to chance. Historically, this stock follows specific seasonal patterns that institutional traders use to maximize returns.
- ✅ Identify the "Golden Buying Window"
- ✅ Avoid high-risk correction cycles
- ✅ Backtested data from the last 20+ years