July 03, 2026 a 11:31 am


ITW: Dividend Analysis - Illinois Tool Works Inc.
Illinois Tool Works Inc. (ITW) presents a robust dividend profile characterized by a stable dividend history of 41 years, a current dividend yield at 2.38%, and a promising growth trajectory in its dividend payouts. As a dominant player in its sector, ITW's commitment to sustaining and growing its dividends highlights its financial resilience and operational excellence. Its prudent financial management, evidenced by a controlled payout ratio, ensures that dividend sustainability is not compromised even amidst market volatilities.
📊 Overview
Illinois Tool Works Inc. operates within the industrial machinery sector, providing critical insights into its long-standing dividend-paying history. With a dividend yield of 2.38% and a current dividend per share of $6.11, ITW has consistently rewarded its investors. The company has maintained its dividend payouts uninterrupted over the past 41 years, a testament to its robust financial health and strategic management approach.
| Parameters | Details |
|---|---|
| Sector | Industrial Machinery Manufacturing |
| Dividend yield | 2.38% |
| Current dividend per share | $6.11 |
| Dividend history | 41 years |
| Last cut or suspension | None |
🗣️ Dividend History
The importance of a solid dividend history cannot be overstated. It attracts income-focused investors and provides a buffer against stock price volatility. ITW’s uninterrupted dividend payments over 41 years underscore its financial discipline and profitability.
| Year | Dividend Per Share (USD) |
|---|---|
| 2026 | 3.22 |
| 2025 | 6.22 |
| 2024 | 5.80 |
| 2023 | 5.42 |
| 2022 | 5.06 |
📈 Dividend Growth
The growth rate of a company's dividend is crucial as it indicates the management's confidence in future earnings growth and cash flow operations. For ITW, the average dividend growth rate over the past five years stands at approximately 7.07%.
| Time | Growth |
|---|---|
| 3 years | 7.12% |
| 5 years | 7.07% |
The average dividend growth is 7.07% over 5 years. This shows moderate but steady dividend growth, portraying management’s optimism on future profitability.
📉 Payout Ratio
Payout ratios, both EPS and FCF based, give insights into the sustainability of a company’s dividend policy. ITW's payout ratio based on EPS is at 56.18%, and on free cash flow, it's 64.15%. These percentages suggest a balanced approach, allowing room for business reinvestment while rewarding shareholders.
| Key figure | Ratio |
|---|---|
| EPS-based | 56.18% |
| Free cash flow-based | 64.15% |
The current payout ratio situation suggests that ITW comfortably supports its dividend policy, balancing rewarding its shareholders and capital revenue for future growth opportunities.
✅ Cashflow & Capital Efficiency
ITW’s cashflow statement and capital efficiency ratios reflect the company’s ability to produce cash and utilize its capital efficiently, which are pivotal for sustaining and growing dividends. The metrics such as free cash flow yield and earnings yield must be analyzed for a comprehensive understanding of financial positioning.
| Metric | 2025 | 2024 | 2023 |
|---|---|---|---|
| Free Cash Flow Yield | 3.76% | 3.78% | 3.89% |
| Earnings Yield | 4.26% | 4.63% | 3.73% |
| CAPEX/OCF | 13.40% | 13.32% | 12.86% |
| Stock-based Comp/Revenue | 0.43% | 0.38% | 0.43% |
| Free Cash Flow / Operating Cash Flow Ratio | 86.60% | 86.68% | 87.14% |
Analyzing ITW’s cashflow efficiency metrics reveals its sound capital management strategies, meeting operational needs while prioritizing shareholder returns, thus enhancing dividend security.
⚠️ Balance Sheet & Leverage Analysis
It is paramount to examine the leverage and liquidity ratios, crucial indicators of ITW’s financial health and ability to meet its financial obligations. A healthy balance sheet helps in ensuring reliable dividend payments.
| Metric | 2025 | 2024 | 2023 |
|---|---|---|---|
| Debt-to-Equity | 2.78 | 2.44 | 2.78 |
| Debt-to-Assets | 55.54% | 53.61% | 53.94% |
| Debt-to-Capital | 73.55% | 70.90% | 73.54% |
| Net Debt to EBITDA | 1.75 | 1.40 | 1.63 |
| Current Ratio | 1.21 | 1.36 | 1.33 |
| Quick Ratio | 0.89 | 0.99 | 0.97 |
| Financial Leverage | 5.01 | 4.54 | 5.15 |
Despite high leverage levels, ITW demonstrates solid debt management capabilities with significant interest coverage and reasonable liquidity ratios, ensuring operational flexibility alongside stable dividends.
📊 Fundamental Strength & Profitability
Monitoring the historical evolution of key profitability ratios provides insights into ITW’s operational efficiency and its ability to generate profits. A company's capability for reinvestment into business operations is crucial for sustainable dividend payouts.
| Metric | 2025 | 2024 | 2023 |
|---|---|---|---|
| Return on Equity | 95.07% | 105.19% | 98.17% |
| Return on Assets | 18.99% | 23.15% | 19.06% |
| Margins: | |||
| Net | 19.11% | 21.94% | 18.36% |
| EBIT | 26.54% | 29.59% | 25.39% |
| EBITDA | 28.98% | 32.12% | 27.84% |
| Gross | 44.09% | 43.65% | 41.46% |
| R&D to Revenue | 8.44% | 1.84% | 1.76% |
With a strong return on equity, ITW indicates superior operational efficiency and effective capital allocation, contributing to sustainable profit growth and ongoing dividend strength.
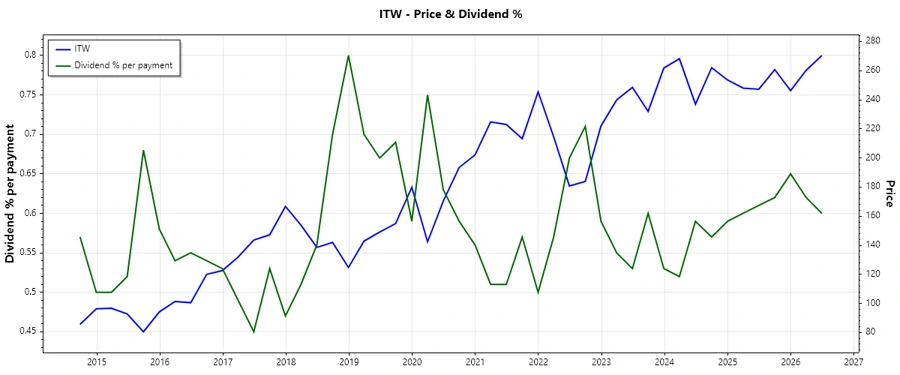
📉 Price Development
Dividend Scoring System
| Criteria | Rating | Score |
|---|---|---|
| Dividend yield | 3/5 | |
| Dividend Stability | 5/5 | |
| Dividend growth | 4/5 | |
| Payout ratio | 4/5 | |
| Financial stability | 4/5 | |
| Dividend continuity | 5/5 | |
| Cashflow Coverage | 3/5 | |
| Balance Sheet Quality | 4/5 |
Total Score: 36/40
✅ Rating
Illinois Tool Works Inc. exhibits strong dividend performance, characterized by stability and growth, backed by solid financial management. A comprehensive examination of ITW's financials and strategic direction suggests that it remains a promising dividend stock, suitable for income-focused investors looking for stability and gradual growth. The firm earns a strong endorsement for its dividend reliability and potential for future appreciation.
Smart Data Insight
Master the Perfect Entry & Exit for this Stock
Don't leave your profits to chance. Historically, this stock follows specific seasonal patterns that institutional traders use to maximize returns.
- ✅ Identify the "Golden Buying Window"
- ✅ Avoid high-risk correction cycles
- ✅ Backtested data from the last 20+ years