
April 27, 2026 a 03:31 pm

ITW: Dividend Analysis - Illinois Tool Works Inc.
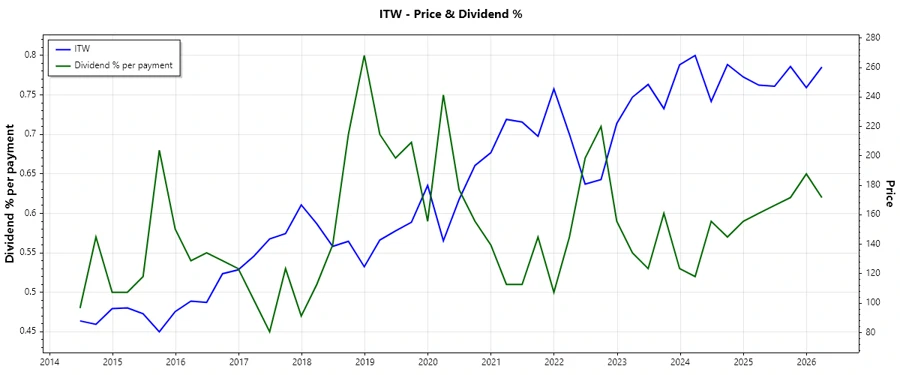
Illinois Tool Works Inc. (ITW) exhibits a robust dividend profile underscored by a consistent dividend history and a moderate growth trend over recent years. With a dividend yield of 2.43%, ITW attracts income-focused investors looking for regular payouts. The company's dividend growth over the years highlights its commitment to returning value to shareholders, although modest compared to industry leaders. ITW's financial ratios reflect an efficient use of capital, maintaining a balance between rewarding shareholders and funding business operations.
Overview 📊
Illinois Tool Works Inc. embodies a well-rounded investment opportunity, particularly for dividend seekers. The firm's long dividend history and stable payouts provide investor confidence. Despite sectors of lower yields, ITW remains competitive through a sustained payout increase, underscoring a resilient financial strategy.
| Factor | Data |
|---|---|
| Sector | Industrials |
| Dividend yield | 2.43 % |
| Current dividend per share | 6.11 USD |
| Dividend history | 41 years |
| Last cut or suspension | None |
Dividend History 🗣️
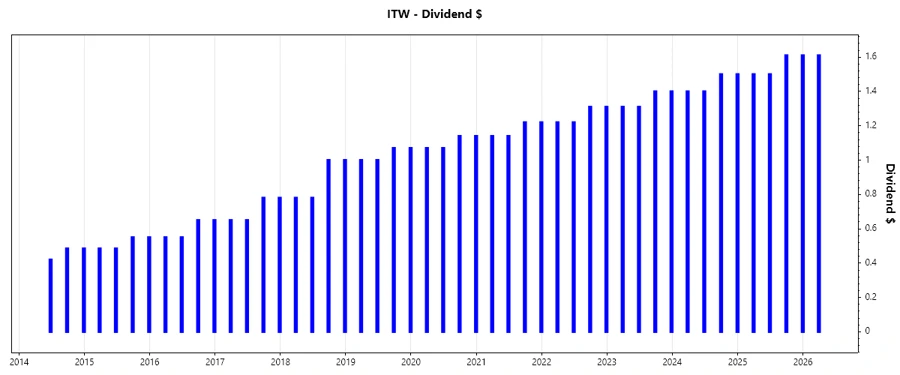
The longevity of ITW's dividend payments speaks volumes about the company's stability and dedication to shareholder returns. A history spanning over four decades without a cut or suspension indicates management's proactive measures in maintaining liquidity and ensuring uninterrupted payouts, providing a reliable income stream for investors.
| Year | Dividend per Share (USD) |
|---|---|
| 2026 | 1.61 |
| 2025 | 6.22 |
| 2024 | 5.80 |
| 2023 | 5.42 |
| 2022 | 5.06 |
Dividend Growth 📈
ITW's dividend growth over the past three and five years reflects steady progress. Continuous growth in dividends is a positive indicator for investors seeking inflation-beating returns and financial confidence within the organization. It also highlights management's strategic capital allocation.
| Time | Growth |
|---|---|
| 3 years | 7.12 % |
| 5 years | 7.07 % |
The average dividend growth is 7.07% over 5 years. This shows moderate but steady dividend growth.
Payout Ratio ✅
The payout ratio is a critical measure of a company's dividend sustainability. ITW's EPS-based payout ratio of 57.85% and free cash flow-based ratio of 65.02% suggest that the dividends are well-covered, providing a buffer against market downturns and allowing for future payout continuity.
| Key figure ratio | Data |
|---|---|
| EPS-based | 57.85 % |
| Free cash flow-based | 65.02 % |
The EPS payout ratio of 57.85% is moderate, suggesting that ITW retains enough earnings to reinvest in the business while rewarding shareholders. Meanwhile, the free cash flow payout ratio of 65.02% is also within a healthy range.
Cashflow & Capital Efficiency ⚠️
Assessing cash flow and capital efficiency is vital for understanding ITW's ability to meet its financial obligations and fund growth. Strong free cash flow combined with adequate capital allocation strategies underlies the company’s continued financial health and ability to pay steady dividends.
| Year | 2025 | 2024 | 2023 |
|---|---|---|---|
| Free Cash Flow Yield | 3.76% | 3.78% | 3.89% |
| Earnings Yield | 4.26% | 4.63% | 3.73% |
| CAPEX to Operating Cash Flow | 13.40% | 13.32% | 12.86% |
| Stock-based Compensation to Revenue | 0.32% | 0.38% | 0.43% |
| Free Cash Flow / Operating Cash Flow Ratio | 86.60% | 86.68% | 87.14% |
ITW maintains a robust cash flow position and superior capital efficiency, ensuring continued operational success and dividend payments.
Balance Sheet & Leverage Analysis 📉
ITW's balance sheet reflects strong financial management with adequate liquidity and controlled leverage. Analyzing leverage ratios highlights how the company maintains its financial health while focusing on sustainable growth and strategic debt utilization.
| Year | 2025 | 2024 | 2023 |
|---|---|---|---|
| Debt-to-Equity | 2.78 | 2.44 | 2.78 |
| Debt-to-Assets | 55.54% | 53.61% | 53.94% |
| Debt-to-Capital | 73.55% | 70.90% | 73.54% |
| Net Debt to EBITDA | 1.75 | 1.40 | 1.63 |
| Current Ratio | 1.21 | 1.36 | 1.33 |
| Quick Ratio | 0.89 | 0.99 | 0.97 |
| Financial Leverage | 5.01 | 4.54 | 5.15 |
ITW's leverage ratios suggest a well-managed balance sheet with effective capital use and minimal financial distress risk.
Fundamental Strength & Profitability
ITW demonstrates strong fundamentals and profitability metrics, reflecting its ability to generate returns and sustain competitive operational margins. The company’s continued reinvestment in R&D is indicative of its focus on innovation and future growth.
| Year | 2025 | 2024 | 2023 |
|---|---|---|---|
| Return on Equity | 95.07% | 105.19% | 98.17% |
| Return on Assets | 18.99% | 23.15% | 19.06% |
| Margins: Net | 19.11% | 21.94% | 18.36% |
| Margins: EBIT | 26.54% | 29.59% | 25.39% |
| Margins: EBITDA | 28.98% | 32.12% | 27.84% |
| Margins: Gross | 44.10% | 43.65% | 41.46% |
| Research & Development to Revenue | 8.53% | 1.84% | 1.76% |
The robust return on equity and consistent profitability margins highlight ITW's efficiency and profitability, positioning it as a strong investment choice.
Price Development
Dividend Scoring System 📊
Evaluate ITW using a comprehensive dividend scoring system to measure its performance across critical areas.
| Category | Score | Indicator |
|---|---|---|
| Dividend yield | 4 | |
| Dividend Stability | 5 | |
| Dividend growth | 3 | |
| Payout ratio | 4 | |
| Financial stability | 4 | |
| Dividend continuity | 5 | |
| Cashflow Coverage | 4 | |
| Balance Sheet Quality | 4 |
Total Score: 33/40
Rating 🏆
ITW presents itself as a fundamentally strong investment with reliable dividends and moderate growth prospects. With a total score of 33 out of 40, ITW is an attractive option for long-term dividend-focused investors. Its strategic focus on consistent payouts and financial stability underpins its investment appeal, making it a worthy consideration in diversified portfolios.
Smart Data Insight
Master the Perfect Entry & Exit for this Stock
Don't leave your profits to chance. Historically, this stock follows specific seasonal patterns that institutional traders use to maximize returns.
- ✅ Identify the "Golden Buying Window"
- ✅ Avoid high-risk correction cycles
- ✅ Backtested data from the last 20+ years