January 01, 2026 a 12:46 pm


ITW: Dividend Analysis - Illinois Tool Works Inc.
Illinois Tool Works Inc. (ITW) demonstrates a robust dividend profile with a longstanding history of distributions. The company's commitment to shareholder returns is evident, with an impressive track record spanning several decades. However, evolving market dynamics and economic conditions necessitate a closer analysis of ITW's dividend sustainability in the long run. This analysis will explore ITW's dividend history, growth prospects, payout ratios, and overall financial health to provide a comprehensive dividend outlook.
📊 Overview
Illinois Tool Works operates predominantly in the industrial goods sector, which is traditionally known for substantial capital investments and innovation-driven growth. Its current dividend yield sits at 2.53%, reflecting its position within the sector. This yield, coupled with a current dividend per share of $5.71, underscores ITW's commitment to delivering steady income for its investors. A dividend history spanning 40 years and a last suspension in 1995 highlights ITW's strong dividend reliability.
| Key Metrics | Details |
|---|---|
| Sector | Industrial Goods |
| Dividend Yield | 2.53% |
| Current Dividend per Share | 5.71 USD |
| Dividend History | 40 years |
| Last Cut or Suspension | 1995 |
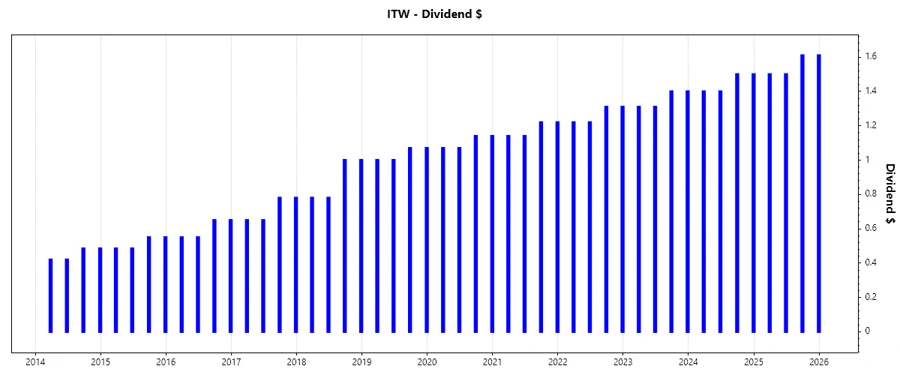
🔍 Dividend History
Understanding the dividend history is crucial as it illuminates a company's commitment to sharing profits with its shareholders. ITW's history of consecutively increasing dividends provides investors with assurance of management's dedication to returning value.
| Year | Dividend per Share |
|---|---|
| 2025 | $6.22 |
| 2024 | $5.80 |
| 2023 | $5.42 |
| 2022 | $5.06 |
| 2021 | $4.72 |
📈 Dividend Growth
Dividend growth is a vital indicator of a company's financial prospects and profitability. ITW's growth rates over 3 and 5 years provide a solid foundation for predicting future payouts.
| Time | Growth |
|---|---|
| 3 years | 7.12% |
| 5 years | 7.07% |
The average dividend growth is 7.07% over 5 years. This shows moderate but steady dividend growth.
🗣️ Payout Ratio
Payout ratios provide insight into a company's ability to sustain dividend payments. ITW's ratios illustrate its financial policy and sustainability of dividend payouts.
| Key Figure | Ratio |
|---|---|
| EPS-based | 54.88% |
| Free Cash Flow-based | 58.77% |
The EPS payout ratio of 54.88% and the FCF-based payout ratio of 58.77% indicate a balanced approach to delivering dividends while reinvesting in the business for future growth.
💼 Cash Flow & Capital Efficiency
Evaluating cash flow and capital efficiency is crucial in determining a company's capacity to finance its operations, reinvest, and reward shareholders.
| 2024 | 2023 | 2022 | |
|---|---|---|---|
| Free Cash Flow Yield | 3.78% | 3.89% | 2.84% |
| Earnings Yield | 4.63% | 3.73% | 4.45% |
| CAPEX to Operating Cash Flow | 13.32% | 12.86% | 17.55% |
| Stock-based Compensation to Revenue | 0.38% | 0.43% | 0.40% |
| Free Cash Flow / Operating Cash Flow Ratio | 86.68% | 87.14% | 82.45% |
| Return on Invested Capital | 27.19% | 24.55% | 23.74% |
These figures reflect ITW’s strong capital management and strategic investment in growth initiatives, showcasing its ability to efficiently utilize its resources.
📉 Balance Sheet & Leverage Analysis
Analyzing the balance sheet and leverage informs investors on financial health, highlighting potential risks associated with debt management.
| 2024 | 2023 | 2022 | |
|---|---|---|---|
| Debt-to-Equity | 2.44 | 2.78 | 2.57 |
| Debt-to-Assets | 0.54 | 0.54 | 0.52 |
| Debt-to-Capital | 0.71 | 0.74 | 0.72 |
| Net Debt to EBITDA | 1.40 | 1.63 | 1.63 |
| Current Ratio | 1.36 | 1.33 | 1.41 |
| Quick Ratio | 0.99 | 0.97 | 0.95 |
| Financial Leverage | 4.54 | 5.15 | 4.99 |
ITW's leverage ratios, while somewhat elevated, are managed effectively, presenting minimal immediate risk given their strong interest coverage and liquidity positions.
💪 Fundamental Strength & Profitability
These metrics gauge the operational and financial performance, reflecting ITW's capacity to generate profit and sustain competitive advantages.
| 2024 | 2023 | 2022 | |
|---|---|---|---|
| Return on Equity | 105.16% | 98.17% | 98.25% |
| Return on Assets | 23.15% | 19.05% | 19.67% |
| Net Margin | 21.94% | 18.36% | 19.04% |
| EBIT Margin | 29.59% | 25.39% | 25.39% |
| EBITDA Margin | 32.12% | 27.84% | 27.96% |
| Gross Margin | 43.65% | 41.46% | 39.98% |
| R&D to Revenue | 1.84% | 1.76% | 1.69% |
These profitability and efficiency ratios demonstrate Illinois Tool Works’ robust operational model and strategic execution in maintaining industry leadership.
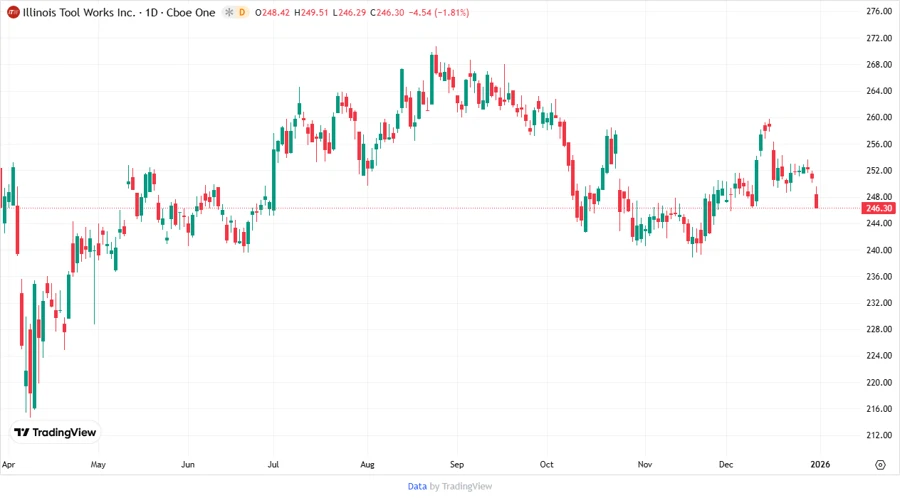
🏷️ Price Development
🔍 Dividend Scoring System
| Criterion | Description | Score |
|---|---|---|
| Dividend Yield | Reflects income potential | 3.5 |
| Dividend Stability | Consistent dividends over the years | 4.25 |
| Dividend Growth | Growth potential of dividends | 4 |
| Payout Ratio | Ability to sustain dividends | 3.75 |
| Financial Stability | Overall company stability | 4.5 |
| Dividend Continuity | Unbroken dividend history | 4.75 |
| Cashflow Coverage | Ability to cover dividends with cash flow | 4 |
| Balance Sheet Quality | Leverage and capital structure | 4.25 |
Total Score: 33/40
⭐ Rating
In conclusion, Illinois Tool Works Inc. boasts a solid dividend profile, underpinned by strong financials and a commitment to shareholder returns. Although its yield is modest compared to some peers, its stability and growth trajectory is commendable. Investors looking for steady income combined with robust capital treatment could find ITW an attractive option. It maintains a strong buy recommendation in dividend-focused portfolios.