October 05, 2025 a 07:31 am
ITW: Dividend Analysis - Illinois Tool Works Inc.
Illinois Tool Works Inc. (ITW) is a stable and highly reputed company known for its consistent dividend payouts. With a robust dividend history of 40 years and a reliable yield of 2.34%, it caters to dividend-focused investors. The company's sustainable payout ratio suggests a balanced approach between rewarding shareholders and retaining earnings for future growth.
Overview 📊
The overview section provides a snapshot of Illinois Tool Works Inc.'s key dividend metrics, assessing the company's capability to maintain its dividend-paying status through different economic cycles.
| Metric | Value |
|---|---|
| Sector | Industrials |
| Dividend yield | 2.34% |
| Current dividend per share | 5.71 USD |
| Dividend history | 40 years |
| Last cut or suspension | None |
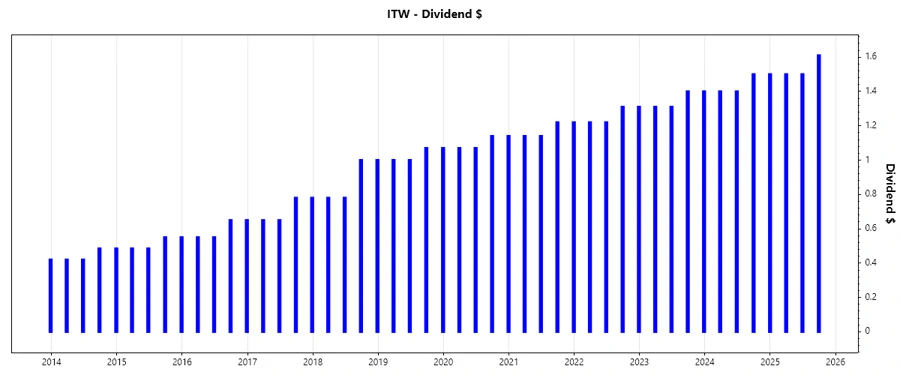
Dividend History 🗣️
Understanding the dividend history is crucial for evaluating a company's commitment to its shareholders. ITW's lengthy, uninterrupted dividend payments highlight its resilience and dedication to providing consistent shareholder returns.
| Year | Dividend per Share (USD) |
|---|---|
| 2025 | 4.61 |
| 2024 | 5.8 |
| 2023 | 5.42 |
| 2022 | 5.06 |
| 2021 | 4.72 |
Dividend Growth 📈
Examining dividend growth allows investors to gauge potential future increases in dividend payouts, reflecting ITW's financial health and operational success. The growth rate over recent years demonstrates a deliberate strategy towards gradual dividend increments.
| Time | Growth |
|---|---|
| 3 years | 7.11% |
| 5 years | 6.98% |
The average dividend growth is 6.98% over 5 years. This shows moderate but steady dividend growth.
Payout Ratio 📉
Payout ratios provide insights into how much of a company's earnings and cash flow are paid out as dividends. A balanced EPS and FCF-based payout ratio indicates financial well-being, supporting ITW’s stable dividend model.
| Key figure | Ratio |
|---|---|
| EPS-based | 49.61% |
| Free cash flow-based | 61.11% |
ITW's payout ratios highlight a sustainable dividend model, with 49.61% EPS-based and 61.11% FCF-based ratios, ensuring dividend security even in earnings fluctuations.
Cashflow & Capital Efficiency ✅
Assessing cash flow metrics and capital efficiency provides an understanding of how well ITW covers dividend obligations and invests in business expansion. Their FCF and earnings yields are crucial indicators.
| Metric | 2024 | 2023 | 2022 |
|---|---|---|---|
| Free Cash Flow Yield | 3.78% | 3.89% | 2.84% |
| Earnings Yield | 4.63% | 3.73% | 4.45% |
| CAPEX to Operating Cash Flow | 13.32% | 12.86% | 17.55% |
| Stock-based Compensation to Revenue | 0.38% | 0.43% | 0.40% |
| Free Cash Flow / Operating Cash Flow Ratio | 86.68% | 87.14% | 82.45% |
Illinois Tool Works shows efficient capital utilization and solid cash flow generation, underlining robust financial fundamentals supporting a healthy dividend payout.
Balance Sheet & Leverage Analysis ⚠️
The balance sheet and leverage metrics display ITW's long-term financial resilience and prudence in managing its debt obligations. Evaluating these metrics helps verify its capability to sustain dividend payments.
| Metric | 2024 | 2023 | 2022 |
|---|---|---|---|
| Debt-to-Equity | 2.44 | 2.78 | 2.57 |
| Debt-to-Assets | 0.54 | 0.54 | 0.52 |
| Debt-to-Capital | 0.71 | 0.74 | 0.72 |
| Net Debt to EBITDA | 1.40 | 1.63 | 1.63 |
| Current Ratio | 1.36 | 1.33 | 1.41 |
| Quick Ratio | 0.99 | 0.97 | 0.95 |
| Financial Leverage | 4.54 | 5.15 | 4.99 |
The metrics reflect a well-managed balance between leveraging and maintaining financial flexibility, key to ITW's continuous shareholder value enhancement through dividends.
Fundamental Strength & Profitability 🏦
By assessing the fundamental strength and profitability metrics, stakeholders can gauge ITW's capacity to generate returns and efficiently allocate resources, indicating sustainable growth and dividend potential.
| Metric | 2024 | 2023 | 2022 |
|---|---|---|---|
| Return on Equity | 105.16% | 98.17% | 98.25% |
| Return on Assets | 23.15% | 19.06% | 19.67% |
| Net Profit Margin | 21.94% | 18.36% | 19.04% |
| EBIT Margin | 29.59% | 25.39% | 25.39% |
| EBITDA Margin | 32.12% | 27.84% | 27.96% |
| Gross Profit Margin | 43.65% | 41.46% | 39.98% |
| R&D to Revenue | 1.84% | 1.76% | 1.69% |
The consistency in profitability metrics underscores ITW’s ability to produce robust returns, enabling auspicious dividend distributions in line with shareholder expectations.
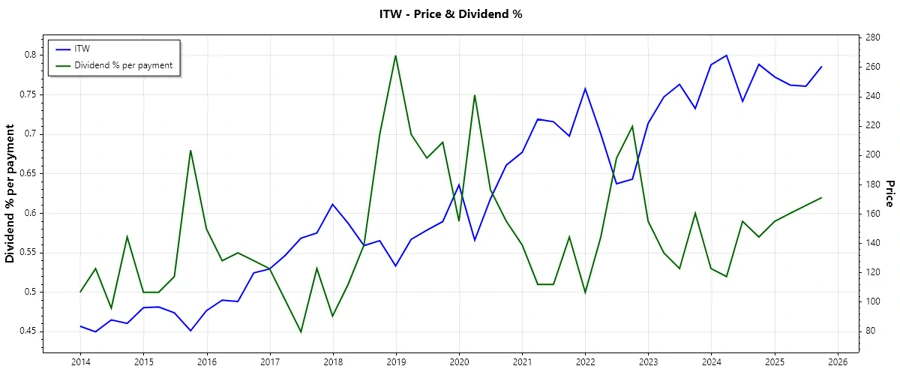
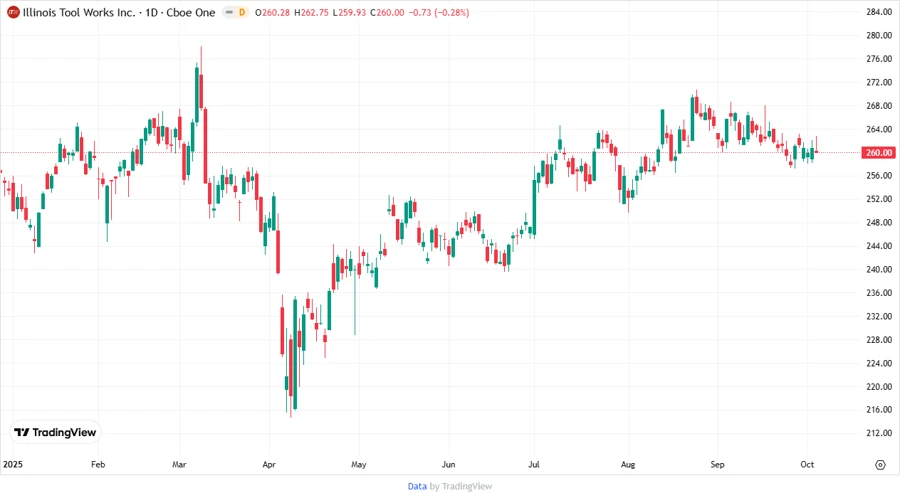
Price Development 📶
Dividend Scoring System 🎯
| Aspect | Score (out of 5) | Score Bar |
|---|---|---|
| Dividend Yield | 3 | |
| Dividend Stability | 5 | |
| Dividend Growth | 4 | |
| Payout Ratio | 4 | |
| Financial Stability | 4 | |
| Dividend Continuity | 5 | |
| Cashflow Coverage | 4 | |
| Balance Sheet Quality | 4 |
Total Score: 33/40
Rating ⭐
Illinois Tool Works Inc. boasts a commendable dividend profile, backed by consistent growth, reliable stability, and solid financial fundamentals. Given its payout discipline and resilient cash flows, ITW remains an attractive option for dividend-focused investors seeking long-term income growth. The company's effective strategy and management underpin a strong recommendation for inclusion in income-focused portfolios.
Smart Data Insight
Master the Perfect Entry & Exit for this Stock
Don't leave your profits to chance. Historically, this stock follows specific seasonal patterns that institutional traders use to maximize returns.
- ✅ Identify the "Golden Buying Window"
- ✅ Avoid high-risk correction cycles
- ✅ Backtested data from the last 20+ years