May 15, 2026 a 03:15 pm
IR: Fibonacci Analysis - Ingersoll Rand Inc.
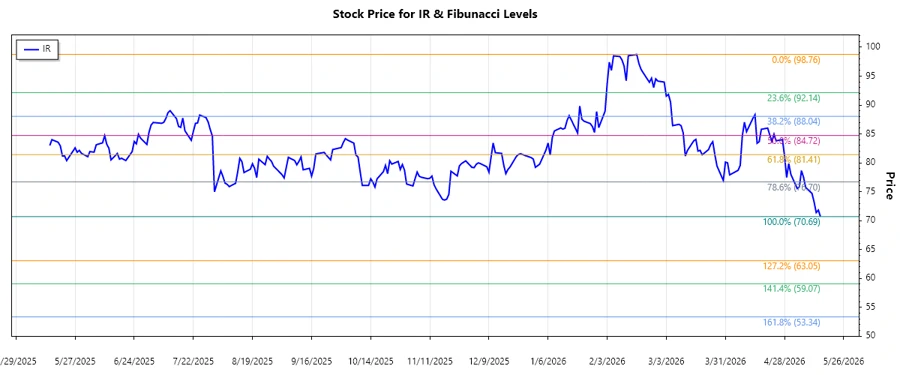
Ingersoll Rand Inc. stock has experienced significant fluctuations over the recent months, with a notable downward trend. This movement suggests potential challenges ahead, yet it also opens opportunities for value investors seeking entry points during correction phases. Technically, the stock is currently showing signs of potential support levels that may stabilize the price.
Fibonacci Analysis
| Period | High | Low | Fibonacci Levels | Current Status |
|---|---|---|---|---|
| 2026-02-17 to 2026-05-15 | $98.76 (2026-02-17) | $70.69 (2026-05-15) |
0.236: $77.57 0.382: $82.41 0.5: $84.73 0.618: $87.05 0.786: $90.26 |
Current Price: $70.69 Retracement Zone: None Interpretation: The current price is below the 0.236 retracement level, indicating further downside potential or an oversold condition. Technical interpretation suggests potential for a reversal or consolidation near current levels, with support expected at the recent low. |
Conclusion
The Ingersoll Rand Inc. stock demonstrates a clear downtrend over the evaluation period, characterized by lower highs and lower lows. The current pricing below the Fibonacci retracement levels could indicate a further downward movement if no considerable support or reversal occurs. This presents a dual-edge scenario where value-driven investors may see potential buying opportunities if the stock indicates reversal patterns. Risks include the continuation of the current downtrend, which could further strain the stock's valuation. Analysts should watch for structural support around the recent low to assess the stock's future trajectory. The technical signals indicate caution but also opportunity for strategic entry points.
Smart Data Insight
Master the Perfect Entry & Exit for this Stock
Don't leave your profits to chance. Historically, this stock follows specific seasonal patterns that institutional traders use to maximize returns.
- ✅ Identify the "Golden Buying Window"
- ✅ Avoid high-risk correction cycles
- ✅ Backtested data from the last 20+ years