October 24, 2025 a 03:16 pm
IR: Fibonacci Analysis - Ingersoll Rand Inc.
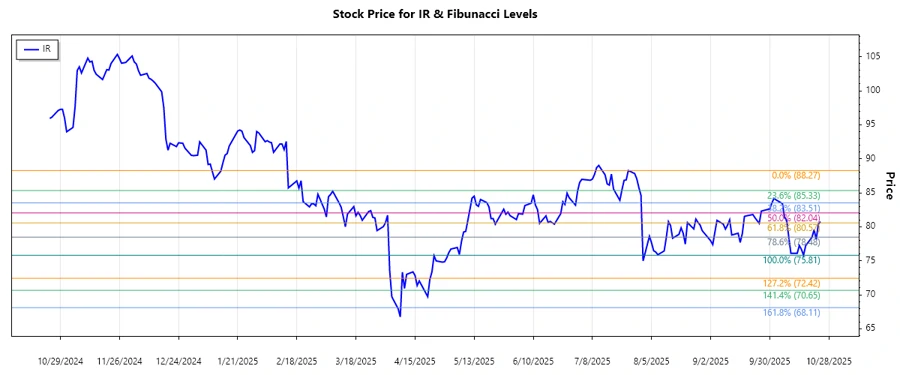
Ingersoll Rand Inc. offers crucial technologies in air, fluid, and specialty vehicle sectors across multiple regions. Recent stock performance indicates a downward trend from July 2025 to October 2025. Conducting a detailed Fibonacci analysis can help identify potential price reversals or key support levels.
Fibonacci Analysis
| Analysis Parameters | Details |
|---|---|
| Trend Start Date | 2025-07-25 |
| Trend End Date | 2025-10-24 |
| High Price (Date) | 88.27 (2025-07-25) |
| Low Price (Date) | 75.81 (2025-10-16) |
The Fibonacci Retracement Levels are calculated based on the recent downtrend:
| Level | Price |
|---|---|
| 0.236 | 78.92 |
| 0.382 | 80.39 |
| 0.5 | 82.04 |
| 0.618 | 83.69 |
| 0.786 | 85.67 |
The current price is around $80.76, which is in the 0.382 retracement zone, suggesting potential resistance at this level. This indicates the stock may face resistance and possibly reverse or pause in this zone.
Conclusion
Ingersoll Rand's recent downtrend reflects broader market conditions affecting industrial stocks. The 0.382 Fibonacci retracement level may serve as resistance, potentially prompting a reversal or consolidation. Investors should monitor the stock's response to this level. Strong technical resistance could indicate further downside risk, but a break above could signal a rally towards higher retracement levels. Long-term growth prospects remain solid, driven by the company's strategic focus on mission-critical technologies.
Smart Data Insight
Master the Perfect Entry & Exit for this Stock
Don't leave your profits to chance. Historically, this stock follows specific seasonal patterns that institutional traders use to maximize returns.
- ✅ Identify the "Golden Buying Window"
- ✅ Avoid high-risk correction cycles
- ✅ Backtested data from the last 20+ years