
July 13, 2026 a 07:46 am

IR: Dividend Analysis - Ingersoll Rand Inc.
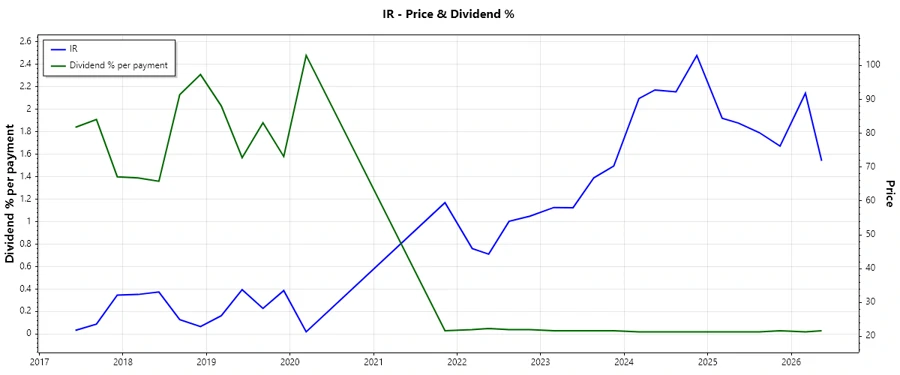
Ingersoll Rand Inc. maintains a consistent presence in the dividends market with its stable yet modest dividend yielding. As we analyze its current financial performance, the company exhibits resilience, underscored by its steady dividend history spanning a decade without major cuts. However, the negative 5-year growth combined with a very low current yield suggests opportunities for improvement in shareholder returns. Prospective investors should weigh the low payout ratio as a potential signal for future growth.
Overview 📊
Ingersoll Rand operates in the Industrial sector, offering diversified products and services with a strategic focus on innovation and operational efficiency. Despite having a low dividend yield of 0.11%, the company has maintained its dividend payouts for 10 years. No recent cut or suspension poses a favorable view for risk-averse income investors.
| Metric | Value |
|---|---|
| Sector | Industrial |
| Dividend Yield | 0.11% |
| Current Dividend Per Share | 0.08 USD |
| Dividend History | 10 years |
| Last Cut or Suspension | None |
Dividend History 🗣️
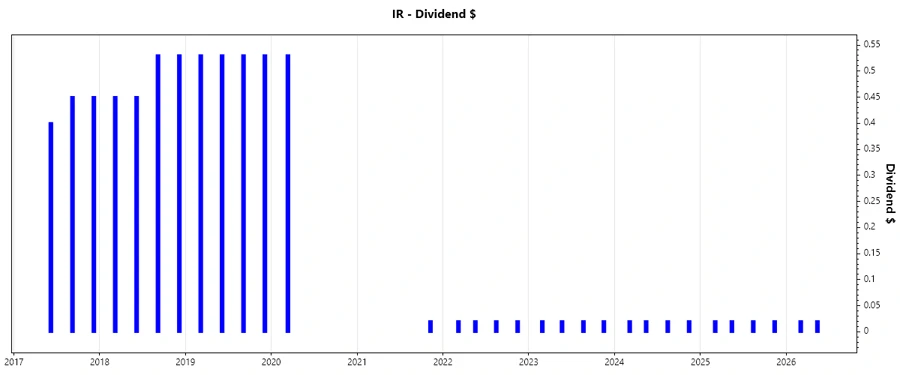
The dividend history of Ingersoll Rand indicates the company's commitment to consistent returns, reiterating its financial stability. Historical dividends are crucial for determining reliability in shareholder payouts.
| Year | Dividend Per Share |
|---|---|
| 2026 | 0.04 |
| 2025 | 0.08 |
| 2024 | 0.08 |
| 2023 | 0.08 |
| 2022 | 0.08 |
Dividend Growth 📈
Examining the dividend growth provides insight into the company's commitment to increasing shareholder value over time. However, a negative 5-year growth of -0.31% indicates challenges in elevating dividend payouts.
| Time | Growth |
|---|---|
| 3 years | 0 % |
| 5 years | -0.31 % |
The average dividend growth is -0.31% over 5 years. This shows moderate but challenging dividend growth which could impact future yield performance.
Payout Ratio 📉
Payout Ratios are key indicators of a company's ability to sustain dividend payments from earnings. Low ratios typically suggest room for dividend growth, while high ratios may indicate pressure on future payouts.
| Key Figure | Ratio |
|---|---|
| EPS-based | 5.33% |
| Free cash flow-based | 2.69% |
The very low EPS (5.33%) and FCF (2.69%) payout ratios suggest a conservative approach, providing flexibility for future dividend increases or reinvestments in business operations.
Cashflow & Capital Efficiency ✅
Cash flow and capital efficiency are critical for understanding the operational capabilities and investment efficiency of a business. Healthy cash flow supports dividend sustainability, while capital efficiency indicates optimal asset utilization.
| Metric | 2025 | 2024 | 2023 |
|---|---|---|---|
| Free Cash Flow Yield | 3.87% | 3.42% | 4.06% |
| Earnings Yield | 1.84% | 2.30% | 2.49% |
| CAPEX to Operating Cash Flow | 10.00% | 10.68% | 7.65% |
| Stock-based Compensation to Revenue | 0.00% | 0.81% | 0.75% |
| Free Cash Flow / Operating Cash Flow Ratio | 90.00% | 89.32% | 92.35% |
Cash flow resilience is evidenced by consistent free cash flow yields around 4%, adequate to cover dividends and re-invest for growth, while maintaining a responsible level of capital expenditures.
Balance Sheet & Leverage Analysis ⚠️
The balance sheet analysis focuses on financial leverage, liquidity, and overall debt capacity. Understanding leverage is essential for gauging risk and stability.
| Metric | 2025 | 2024 | 2023 |
|---|---|---|---|
| Debt-to-Equity | 0.48 | 0.49 | 0.28 |
| Debt-to-Assets | 0.27 | 0.28 | 0.18 |
| Debt-to-Capital | 0.32 | 0.33 | 0.22 |
| Net Debt to EBITDA | 2.30 | 1.88 | 0.71 |
| Current Ratio | 2.06 | 2.29 | 2.22 |
| Quick Ratio | 1.49 | 1.71 | 1.67 |
| Financial Leverage | 1.81 | 1.77 | 1.59 |
Ingersoll Rand showcases a well-balanced debt profile, illustrated by declining debt-to-equity ratios and strong interest coverage. However, the increase in net debt to EBITDA in 2025 indicates caution might be warranted.
Fundamental Strength & Profitability 📈
Key profitability ratios provide insight into corporate health and earnings capability. High returns on assets and equity reflect efficient management practices aligned with shareholder interests.
| Metric | 2025 | 2024 | 2023 |
|---|---|---|---|
| Return on Equity | 5.76% | 8.24% | 7.96% |
| Return on Assets | 3.18% | 4.66% | 5.00% |
| Net Margin | 7.60% | 11.59% | 11.32% |
| EBIT Margin | 13.88% | 18.60% | 17.27% |
| EBITDA Margin | 20.49% | 25.27% | 23.95% |
| Gross Margin | 38.54% | 43.81% | 41.92% |
| R&D to Revenue | 0.00% | 0.00% | 0.00% |
Ingersoll Rand's solid return on equity and asset margins, coupled with robust profit margins, affirm its potential for long-term growth. The lack of R&D expenses could raise concerns over innovation and long-term competitive positioning.
Price Development 📉
Dividend Scoring System 📊
| Category | Score | Score Bar |
|---|---|---|
| Dividend Yield | 1 | |
| Dividend Stability | 4 | |
| Dividend Growth | 2 | |
| Payout Ratio | 4 | |
| Financial Stability | 3 | |
| Dividend Continuity | 5 | |
| Cashflow Coverage | 4 | |
| Balance Sheet Quality | 3 |
Overall Score: 26/40
Rating 🏆
Overall, Ingersoll Rand Inc. presents a stable dividend profile with strong continuity and healthy payout ratios. Although the current yield is low and recent growth rates unfavorable, the robust financial base and established market presence make the company a viable contender for conservative growth-oriented investors. We recommend considering Ingersoll Rand for balance-seeking portfolios with the expectation of potential long-term improvements in dividend payouts.
Smart Data Insight
Master the Perfect Entry & Exit for this Stock
Don't leave your profits to chance. Historically, this stock follows specific seasonal patterns that institutional traders use to maximize returns.
- ✅ Identify the "Golden Buying Window"
- ✅ Avoid high-risk correction cycles
- ✅ Backtested data from the last 20+ years