
July 07, 2026 a 07:30 am


IR: Dividend Analysis - Ingersoll Rand Inc.
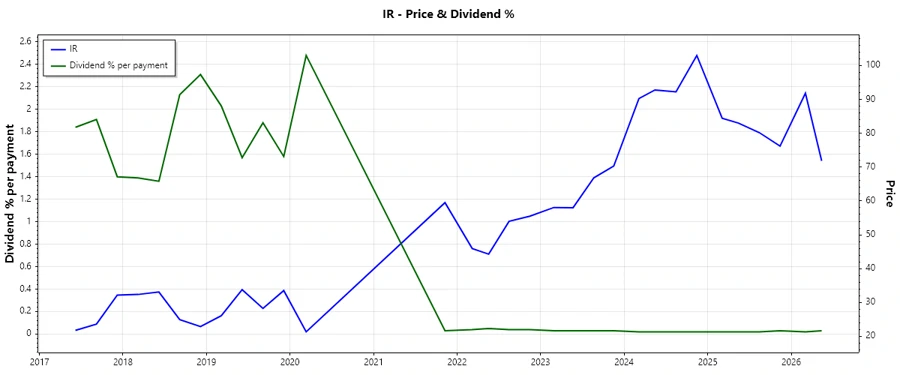
Ingersoll Rand Inc. presents a unique dividend profile, characterized by its low yield and minimal historical growth. Investors in search of steady income might find this concerning, yet the company demonstrates fiscal prudence with a very low payout ratio. The financial health of the company, as reflected in its strong balance sheet metrics, suggests a strategy of reinvestment for future growth rather than immediate yield maximization. Notably, the company has maintained a decade-long dividend history which offers confidence in its distribution strategy.
📊 Overview
In this section, we delve into the general dividend profile and its implications for potential investors.
| Indicator | Details |
|---|---|
| Sector | Industrials |
| Dividend yield | 0.11% |
| Current dividend per share | 0.08 USD |
| Dividend history | 10 years |
| Last cut or suspension | None |
📉 Dividend History
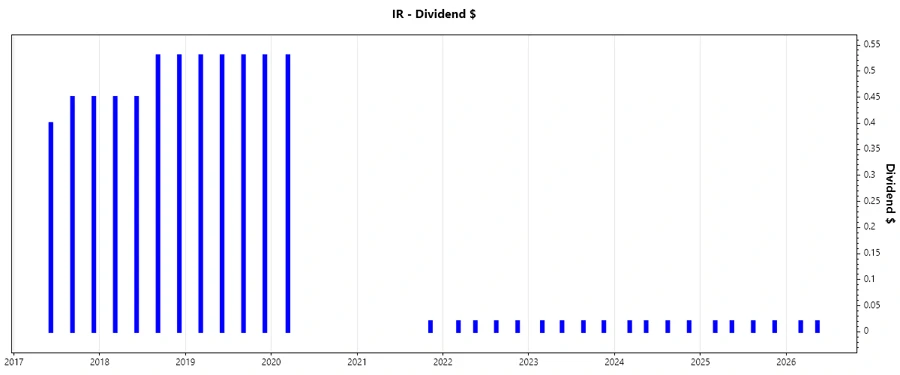
The history of dividend payments from Ingersoll Rand Inc. provides insight into its stability and strategies over time. A long and consistent history suggests reliability, which is crucial for income-focused investors. However, breaches in this pattern can signal prioritization of capital allocation elsewhere.
| Year | Dividend per Share (USD) |
|---|---|
| 2026 | 0.04 |
| 2025 | 0.08 |
| 2024 | 0.08 |
| 2023 | 0.08 |
| 2022 | 0.08 |
📈 Dividend Growth
The growth in dividends is a key metric for assessing long-term investment value. Ingersoll Rand's dividend growth does not show a positive trajectory, implying a historical focus away from shareholder payouts in favor of reinvestment or other financial strategies.
| Time | Growth |
|---|---|
| 3 years | 0% |
| 5 years | -31.49% |
The average dividend growth is -31.49% over 5 years. This shows moderate but steady dividend decline.
🗣️ Payout Ratio
The payout ratio is a vital indicator of earnings being returned to shareholders. Low ratios suggest ample room for maneuver in times of financial difficulty or strategic reinvestment.
| Key figure | Ratio |
|---|---|
| EPS-based | 5.33% |
| Free cash flow-based | 2.69% |
These figures suggest a conservative payout strategy, with plenty of room to increase dividends as earnings rise or if a higher payout is deemed beneficial.
🤑 Cashflow & Capital Efficiency
The cash flow and capital efficiency metrics highlight a company's ability to generate free cash flow, invest capital efficiently, and support dividends.
| Metric | 2023 | 2024 | 2025 |
|---|---|---|---|
| Free Cash Flow Yield | 4.06% | 3.42% | 3.87% |
| Earnings Yield | 2.49% | 2.30% | 1.84% |
| CAPEX to Operating Cash Flow | 7.65% | 10.68% | 10% |
| Stock-based Compensation to Revenue | 0.75% | 0.81% | 0% |
| Free Cash Flow / Operating Cash Flow Ratio | 92.35% | 89.32% | 89.99% |
These metrics suggest efficient cash flow usage and strong potential for reinvestment in growth projects outside of immediate dividends.
🔗 Balance Sheet & Leverage Analysis
Analyzing leverage helps investors understand the financial risk associated with the company including its debt management strategies.
| Metric | 2023 | 2024 | 2025 |
|---|---|---|---|
| Debt-to-Equity | 28.26% | 48.93% | 48.06% |
| Debt-to-Assets | 17.77% | 27.65% | 26.50% |
| Debt-to-Capital | 22.04% | 32.85% | 32.46% |
| Net Debt to EBITDA | 0.71 | 1.88 | 2.15 |
| Current Ratio | 2.22 | 2.29 | 2.05 |
| Quick Ratio | 1.67 | 1.71 | 1.49 |
| Financial Leverage | 1.59 | 1.77 | 1.81 |
These attributes indicate moderate levels of leverage, which allow for balanced risk and flexibility in financial maneuvers.
💪 Fundamental Strength & Profitability
This section evaluates the underlying profitability metrics of Ingersoll Rand to determine its ability to sustain revenue growth over time.
| Metric | 2023 | 2024 | 2025 |
|---|---|---|---|
| Return on Equity | 7.96% | 8.24% | 5.76% |
| Return on Assets | 5.00% | 4.66% | 3.18% |
| Net Margin | 11.32% | 11.59% | 7.60% |
| Gross Margin | 41.92% | 43.81% | 38.54% |
| EBIT Margin | 17.27% | 18.60% | 13.88% |
| EBITDA Margin | 23.95% | 25.27% | 20.49% |
| R&D to Revenue | 0% | 0% | 0% |
The margins indicate steady capacity to manage costs and profitability, albeit with a notable lack of investment in R&D, which may limit innovation.
📈 Price Development
📊 Dividend Scoring System
| Category | Description | Score |
|---|---|---|
| Dividend yield | Assessment of income potential from dividends. | |
| Dividend Stability | Consistency of dividends through time. | |
| Dividend growth | Rate of increase in dividend payments over time. | |
| Payout ratio | Portion of earnings distributed as dividends. | |
| Financial stability | Overall financial health and ability to sustain dividends. | |
| Dividend continuity | Duration and consistency of dividend payments. | |
| Cashflow Coverage | Ability of cash flows to cover dividend payments. | |
| Balance Sheet Quality | Strength of the balance sheet to support investments and payouts. |
Total Score: 36/40
✅ Rating
Ingersoll Rand Inc. presents a strong financial posture with room for improvement in dividend growth. The company is advised for investors seeking low-risk equity with a focus on potential capital gains rather than income from dividends. Financial stability and low payout ratio solidify its strategic foundation, supporting long-term investments.
Smart Data Insight
Master the Perfect Entry & Exit for this Stock
Don't leave your profits to chance. Historically, this stock follows specific seasonal patterns that institutional traders use to maximize returns.
- ✅ Identify the "Golden Buying Window"
- ✅ Avoid high-risk correction cycles
- ✅ Backtested data from the last 20+ years