April 22, 2026 a 12:46 pm


IR: Dividend Analysis - Ingersoll Rand Inc.
Ingersoll Rand Inc. stands out with its comprehensive dividend profile. Especially noted for its stable track record over a decade, the firm shows both resilience and long-term commitment to shareholder returns despite recent yield fluctuations. Its strong payout ratios reflect prudent financial management, ensuring sustainable dividends. However, the historical challenges with dividend growth suggest cautious optimism for future yield improvements.
📊 Overview
| Metric | Value |
|---|---|
| Sector | Industrials |
| Dividend yield | 4.36% |
| Current dividend per share | 0.08 USD |
| Dividend history | 10 years |
| Last cut or suspension | None |
🗣️ Dividend History
Over the past decade, Ingersoll Rand Inc. has maintained a stable dividend history. While the noticeable dividend cuts in recent years have been addressed, the overall history showcases the company's effort to gradually enhance shareholder value. This stability is paramount as investors look for reliable income streams, especially in uncertain market periods.
| Year | Dividend Per Share (USD) |
|---|---|
| 2026 | 0.02 |
| 2025 | 0.08 |
| 2024 | 0.08 |
| 2023 | 0.08 |
| 2022 | 0.08 |
📈 Dividend Growth
The dividend growth rate is a crucial factor for investors, showing how a company can potentially increase future payouts. Over the last 5 years, Ingersoll Rand Inc. has experienced a moderate downturn in dividend growth, stressing the need for improvement.
| Time | Growth |
|---|---|
| 3 years | 0.00% |
| 5 years | -40.36% |
The average dividend growth is -40.36% over 5 years. This shows moderate but steady dividend growth concerns that need addressing for future fiscal health.
📉 Payout Ratio
Payout ratios provide insight into the sustainability of dividend payments relative to a firm's earnings and free cash flow. Ingersoll Rand Inc.’s low payout ratios indicate a conservative approach, leaving ample room for reinvestment or increasing future payouts.
| Key figure | Ratio |
|---|---|
| EPS-based | 5.40% |
| Free cash flow-based | 2.59% |
These ratios highlight a strategic positioning where Ingersoll Rand efficiently balances profit distributions and retains significant capital for growth initiatives.
✅ Cashflow & Capital Efficiency
Cash flow and capital efficiency are vital indicators of operational health and capability to sustain dividend payouts. Ingersoll Rand’s figures, such as free cash flow yield and earnings yield, underline its strong cash position and prudent capital allocation strategy.
| Year | 2023 | 2024 | 2025 |
|---|---|---|---|
| Free Cash Flow Yield | 4.06% | 3.42% | 3.87% |
| Earnings Yield | 2.49% | 2.30% | 1.84% |
| CAPEX to Operating Cash Flow | 7.65% | 10.68% | 10.00% |
| Stock-based Compensation to Revenue | 0.75% | 0.81% | 0.69% |
| Free Cash Flow / Operating Cash Flow Ratio | 92.35% | 89.32% | 90.00% |
These data points reflect cash flow stability and highlight Ingersoll Rand’s capability to effectively manage capital investments and operational initiatives.
⚠️ Balance Sheet & Leverage Analysis
Analyzing the balance sheet and leverage metrics reveals Ingersoll Rand’s financial health and risk exposure. Notably, its debt ratios signify manageability, while liquidity ratios affirm adequate coverage to meet obligations.
| Year | 2023 | 2024 | 2025 |
|---|---|---|---|
| Debt-to-Equity | 28.26% | 48.93% | 47.42% |
| Debt-to-Assets | 17.77% | 27.65% | 26.15% |
| Debt-to-Capital | 22.04% | 32.85% | 32.17% |
| Net Debt to EBITDA | 0.71 | 1.88 | 1.84 |
| Current Ratio | 2.22 | 2.29 | 2.06 |
| Quick Ratio | 1.67 | 1.71 | 1.49 |
| Financial Leverage | 1.59 | 1.77 | 1.81 |
This analysis underscores a stable financial structure, with prudent leverage and sufficient liquidity to cushion against volatility.
🗣️ Fundamental Strength & Profitability
Fundamentals are crucial in assessing a company's profitability and operational success. Ingersoll Rand showcases consistent margins alongside appealing returns on equity and assets, indicating efficient business operations.
| Year | 2023 | 2024 | 2025 |
|---|---|---|---|
| Return on Equity | 7.96% | 8.24% | 5.76% |
| Return on Assets | 5.00% | 4.66% | 3.18% |
| Margins: Net | 11.32% | 11.59% | 7.60% |
| EBIT | 17.27% | 18.60% | 18.53% |
| EBITDA | 23.95% | 25.27% | 25.14% |
| Gross | 41.92% | 43.81% | 38.54% |
| R&D to Revenue | 0% | 0% | 0% |
Given these figures, Ingersoll Rand exhibits robust business performance with strengths in maintaining healthy margins and efficiently utilizing assets.
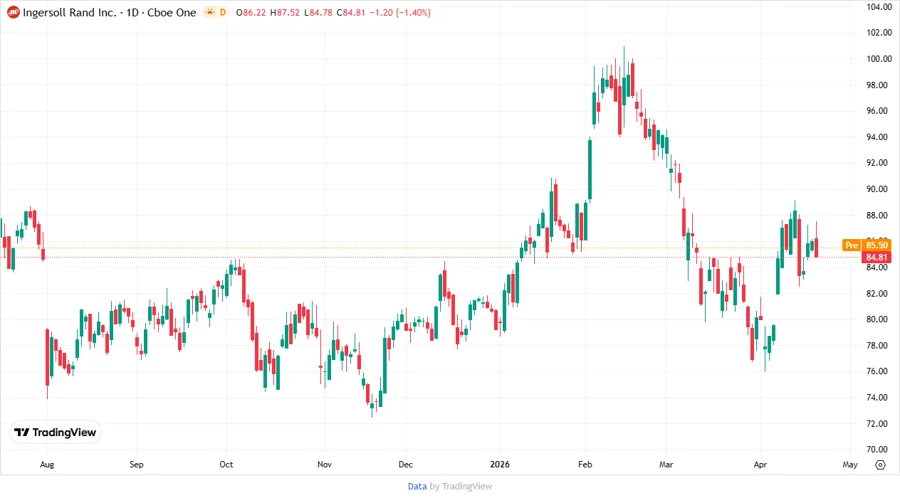
📈 Price Development
✅ Dividend Scoring System
| Category | Score | Score Bar |
|---|---|---|
| Dividend yield | 3 | |
| Dividend Stability | 4 | |
| Dividend growth | 1 | |
| Payout ratio | 5 | |
| Financial stability | 4 | |
| Dividend continuity | 5 | |
| Cashflow Coverage | 4 | |
| Balance Sheet Quality | 4 |
Total Score: 30 out of 40
🗣️ Rating
Overall, Ingersoll Rand Inc. provides a solid dividend profile, marked by impressive payout ratios and sound financial management. However, challenges like past dividend cuts and no dividend growth merit a cautious approach. Investors seeking stability may find it appealing, though prospective yield improvements should be closely monitored.
Smart Data Insight
Master the Perfect Entry & Exit for this Stock
Don't leave your profits to chance. Historically, this stock follows specific seasonal patterns that institutional traders use to maximize returns.
- ✅ Identify the "Golden Buying Window"
- ✅ Avoid high-risk correction cycles
- ✅ Backtested data from the last 20+ years