April 09, 2026 a 03:31 am
IR: Dividend Analysis - Ingersoll Rand Inc.
Ingersoll Rand Inc., renowned for its consistent market presence, has shown a relatively stable but modest dividend yield. Despite a recent lack of dividend growth, the company's financial health appears resilient with a low payout ratio, ensuring sustainable distributions. While the recent dividend history doesn't display dramatic increments, the company’s commitment to shareholder returns is evident through its continuous dividend policy. However, future dividend growth remains a critical aspect to watch.
📊 Overview
| Parameter | Details |
|---|---|
| Sector | Industrial Manufacturing |
| Dividend yield | 0.09 % |
| Current dividend per share | 0.08 USD |
| Dividend history | 10 years |
| Last cut or suspension | None |
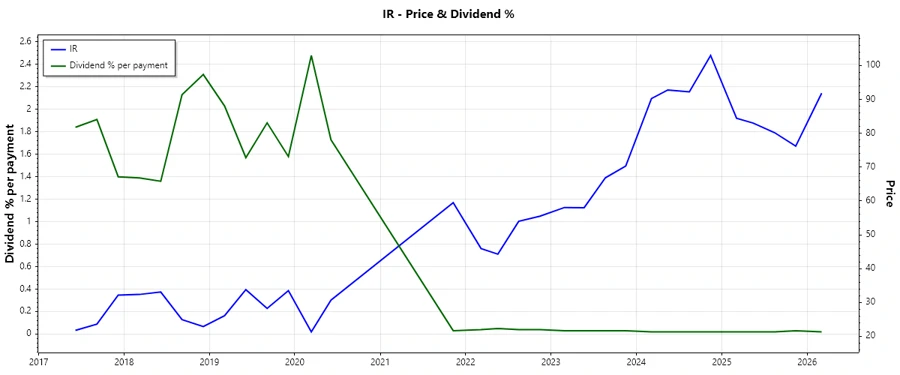
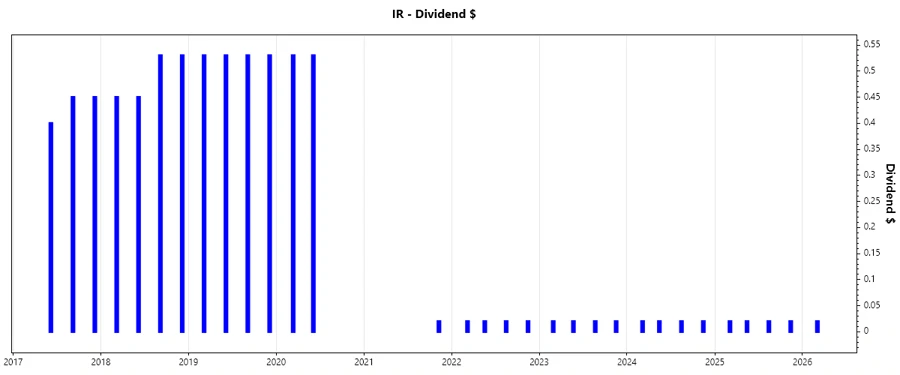
🗣️ Dividend History
The dividend history of Ingersoll Rand reveals a structured but historically fluctuating pattern of distributions per share. Critical in understanding investor confidence, these payouts help illustrate the company’s financial priorities and its ability to generate sufficient earnings over time.
| Year | Dividend per Share ($) |
|---|---|
| 2026 | 0.02 |
| 2025 | 0.08 |
| 2024 | 0.08 |
| 2023 | 0.08 |
| 2022 | 0.08 |
📈 Dividend Growth
Examining dividend growth offers insight into a company's potential to increase shareholder returns. With negative growth over five years, Ingersoll Rand shows a decline, triggering analysis on sustainability and future potential to enhance investor yield.
| Time | Growth |
|---|---|
| 3 years | 0 % |
| 5 years | -0.40 % |
The average dividend growth is -0.40 % over 5 years. This shows moderate but steady dividend growth challenges, highlighting the need for strategic enhancements.
✅ Payout Ratio
Payout ratios signify the proportion of earnings distributed as dividends, essential for assessing dividend sustainability. Ingersoll Rand exhibits conservative ratios, indicating room for future dividend enhancements and financial maneuverability.
| Key figure | Ratio |
|---|---|
| EPS-based | 5.40 % |
| Free cash flow-based | 2.59 % |
With an EPS payout of 5.40 % and FCF payout of 2.59 %, Ingersoll Rand maintains a low payout ratio, emblematic of conservative financial stewardship and dividend sustainability but suggestive of potential underutilized shareholder return capacity.
Cashflow & Capital Efficiency
Evaluating cash flows and capital efficacy provides insight into liquidity, financial resilience, and the potential for future investment capabilities or shareholder returns. Ingersoll Rand's metrics indicate a sophisticated alignment between operational cash deployment and investment returns.
| Metric | 2023 | 2024 | 2025 |
|---|---|---|---|
| Free Cash Flow Yield | 4.06 % | 3.41 % | 3.87 % |
| Earnings Yield | 2.49 % | 2.30 % | 1.84 % |
| CAPEX to Operating Cash Flow | 7.65 % | 10.68 % | 10.00 % |
| Stock-based Compensation to Revenue | 0.75 % | 0.81 % | 0.69 % |
| Free Cash Flow / Operating Cash Flow Ratio | 92.35 % | 89.32 % | 89.90 % |
Leveraging its operational cash flow efficiently, Ingersoll Rand demonstrates robust capital efficiency and free cash flow generation capability, a precursor for sustained financial maneuvering.
Balance Sheet & Leverage Analysis
Analysis of the balance sheet and leverage metrics yield insights into company solvency, capital structure efficiency, and risk exposure, essential for determining debt management strategies.
| Metric | 2023 | 2024 | 2025 |
|---|---|---|---|
| Debt-to-Equity | 28.26 % | 48.93 % | 47.42 % |
| Debt-to-Assets | 17.77 % | 27.65 % | 26.15 % |
| Debt-to-Capital | 22.04 % | 32.85 % | 32.17 % |
| Net Debt to EBITDA | 0.71 | 1.88 | 1.84 |
| Current Ratio | 2.22 | 2.29 | 2.06 |
| Quick Ratio | 1.67 | 1.71 | 1.49 |
| Financial Leverage | 1.59 | 1.77 | 1.81 |
Ingersoll Rand's leverage strategy shows an effective balance between utilization of debt and maintaining solvency, underpinning a resilient capital structure for sustainable growth.
Fundamental Strength & Profitability
Assessing profitability and fundamental strength reveals the efficiency in generating returns and managing operational costs, essential for driving shareholder value.
| Metric | 2023 | 2024 | 2025 |
|---|---|---|---|
| Return on Equity | 7.96 % | 8.24 % | 5.76 % |
| Return on Assets | 5.00 % | 4.66 % | 3.18 % |
| Margins: Net | 11.32 % | 11.59 % | 7.60 % |
| Margins: EBIT | 17.27 % | 18.60 % | 18.53 % |
| Margins: EBITDA | 23.95 % | 25.27 % | 25.14 % |
| Margins: Gross | 41.92 % | 43.81 % | 38.54 % |
| Research & Development to Revenue | 0 % | 0 % | 0 % |
Despite marginal profitability growth, Ingersoll Rand retains strong foundational metrics, enabling superior returns on equity and assets, reflecting effective management and operational strategies.
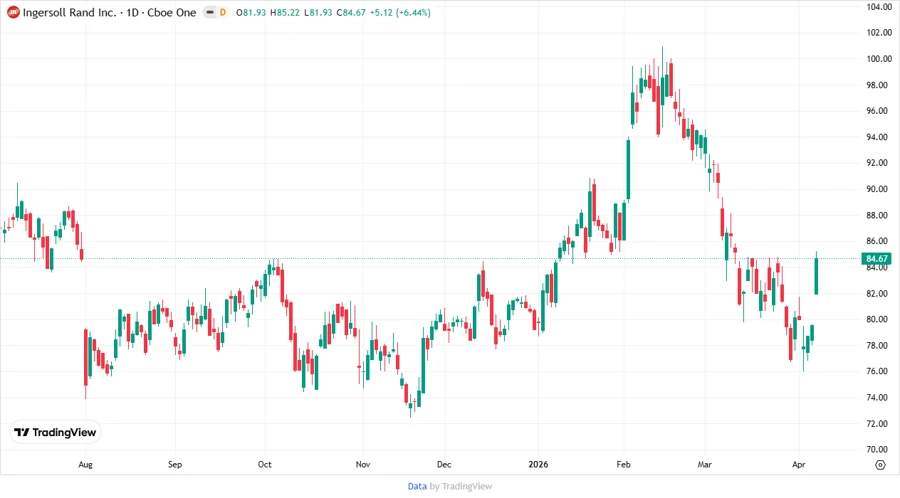
📉 Price Development
Dividend Scoring System
| Criteria | Score | Relevance |
|---|---|---|
| Dividend yield | 3 | |
| Dividend Stability | 2 | |
| Dividend growth | 1 | |
| Payout ratio | 4 | |
| Financial stability | 4 | |
| Dividend continuity | 3 | |
| Cashflow Coverage | 3 | |
| Balance Sheet Quality | 3 |
Overall Score: 23/40
Rating
Ingersoll Rand showcases a mixed dividend profile typified by a commitment to steady payouts with limited growth potential. Given a moderate scoring from the analysis, it maintains financial sensibility and robust capital structure but requires strategic enhancements to invigorate future dividend expansion. An investment consideration for conservative income-focused investors seeking stability over aggressive yield increments.
Smart Data Insight
Master the Perfect Entry & Exit for this Stock
Don't leave your profits to chance. Historically, this stock follows specific seasonal patterns that institutional traders use to maximize returns.
- ✅ Identify the "Golden Buying Window"
- ✅ Avoid high-risk correction cycles
- ✅ Backtested data from the last 20+ years